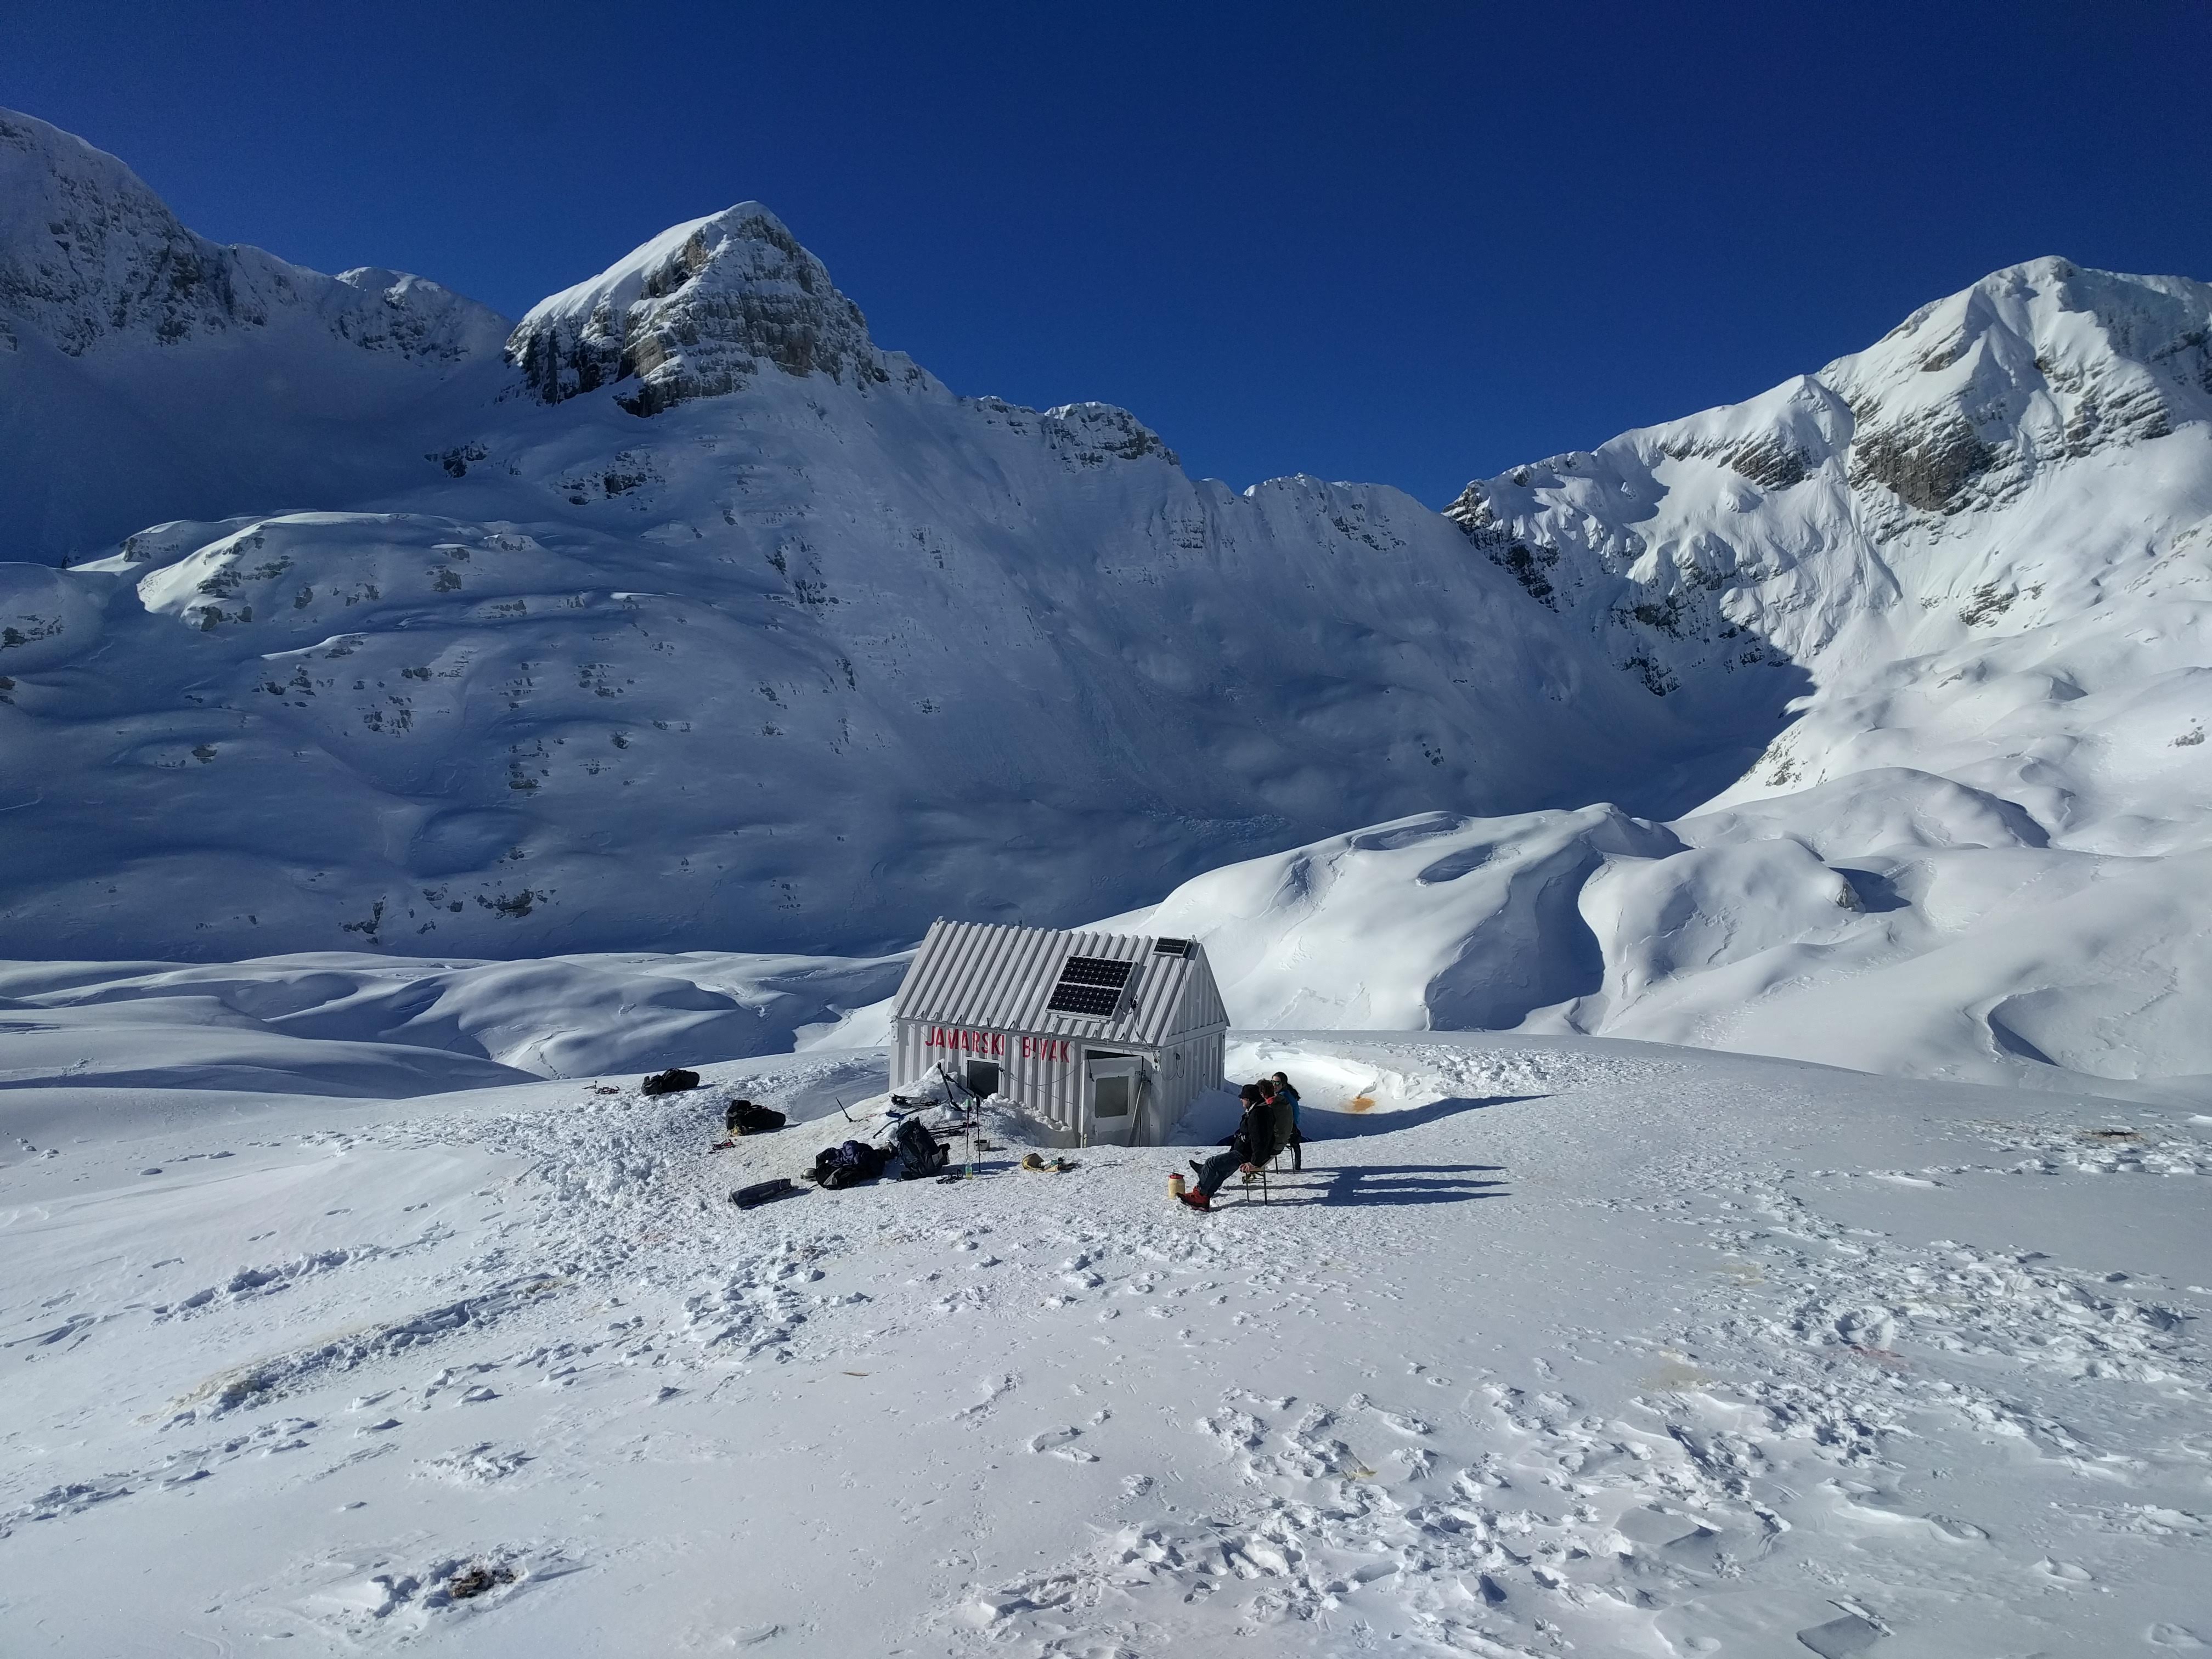
Find out about our recent work inside moulins on the Greenland Ice Sheet, which challenges current understanding about the role moulins play in regulating water pressure beneath the ice. For a brief summary of our work see this Arkansas Newswire article.
For a presentation on the adventure of of exploring Greenland’s moulins see this talk given for the National Speleological Society 2020 convention.
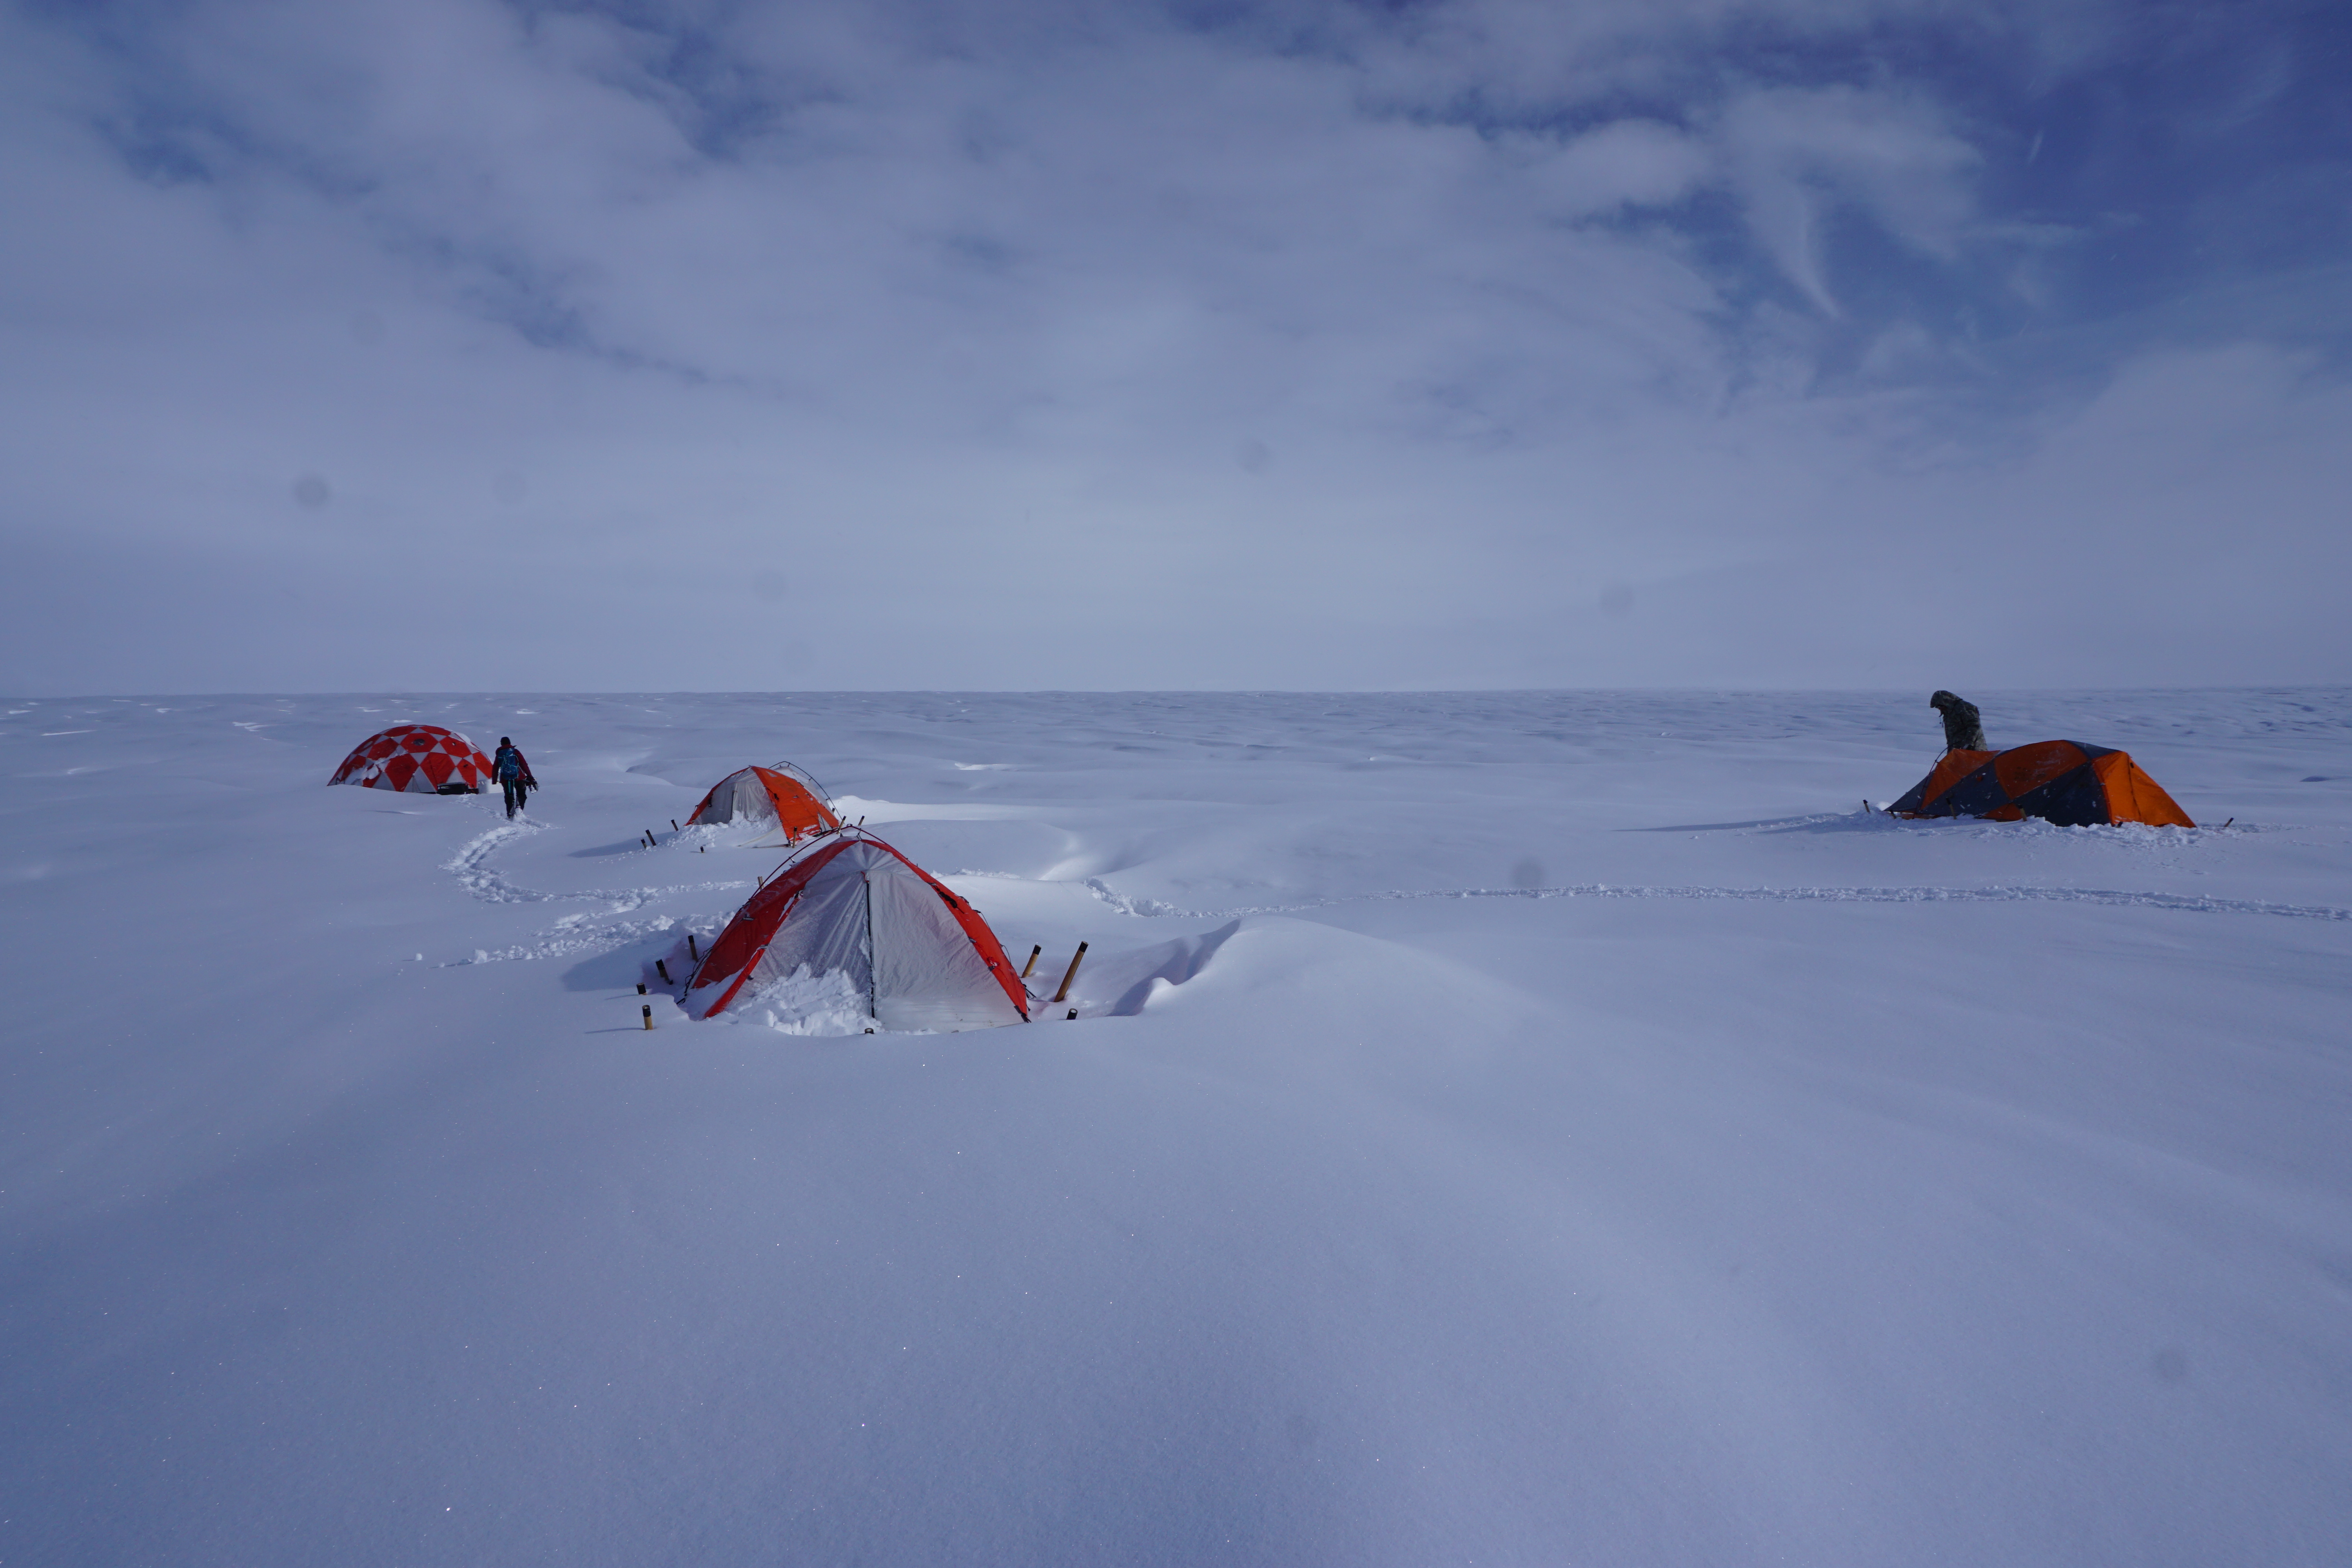
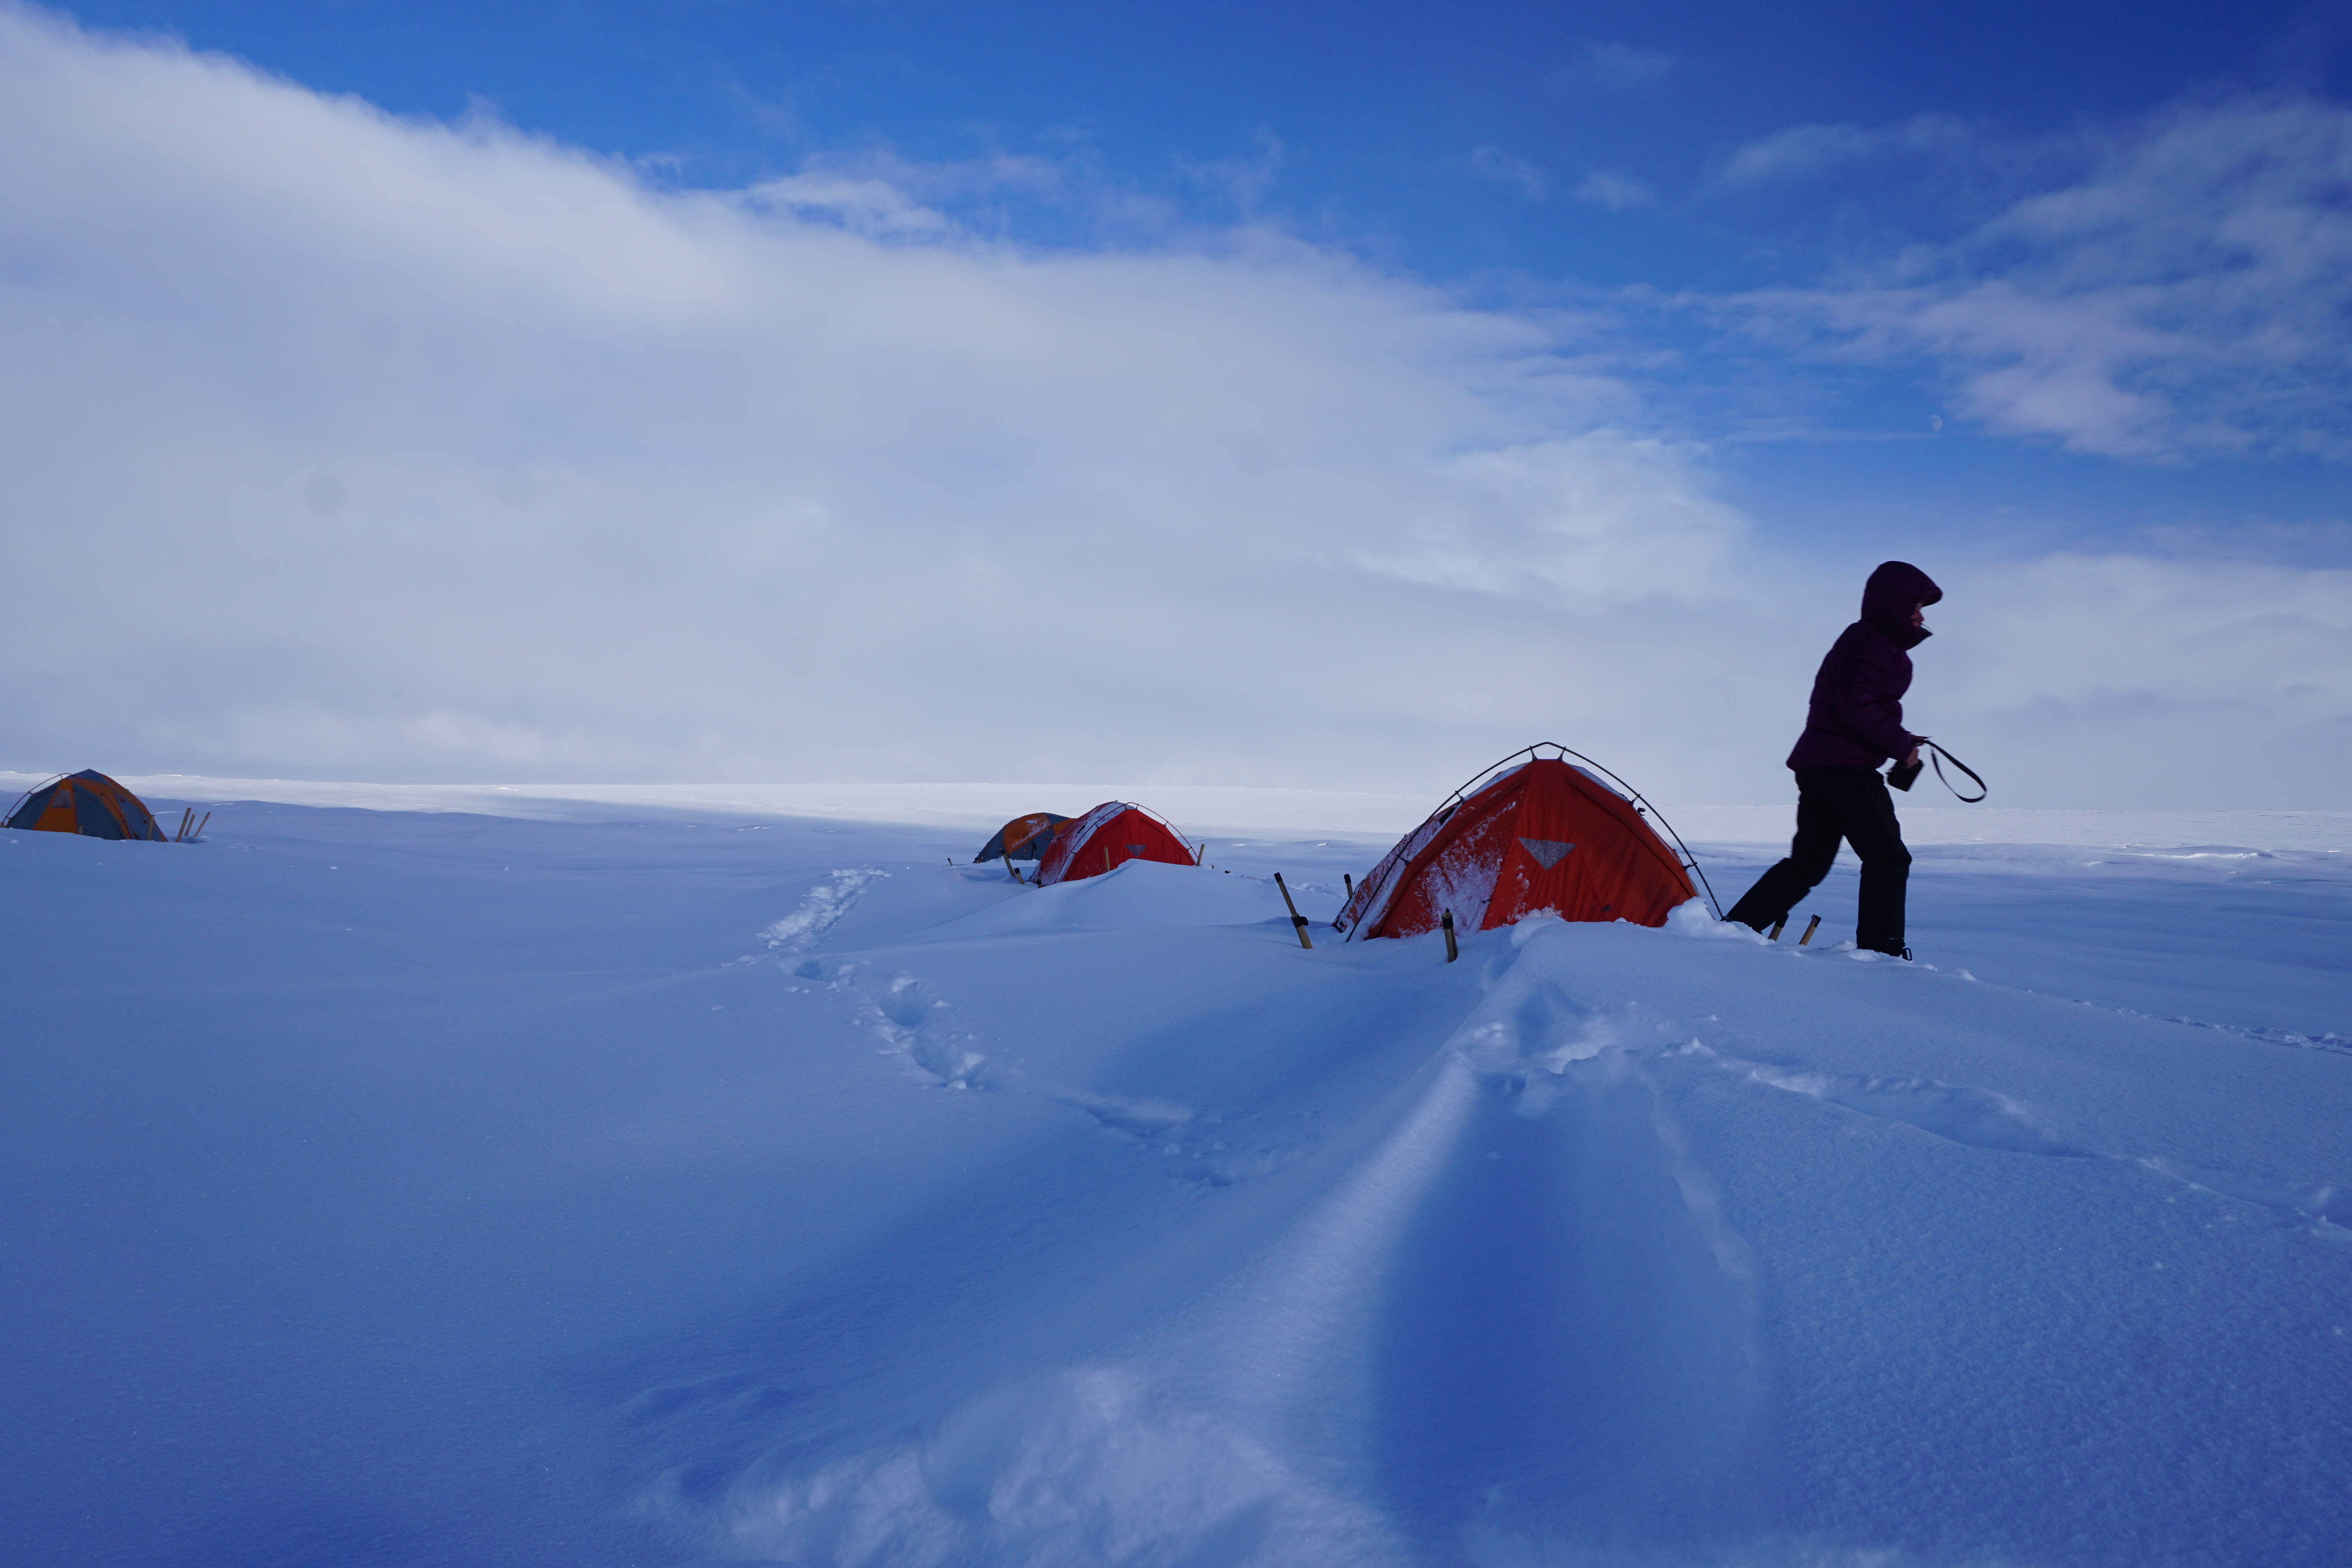
The night we arrived, after setting up our camp, we were hit by a snowstorm. Around 30 cm of snow fell overnight, and more continued to come over the next few days. There was sufficient drifting snow to cover most of the surface features on the ice sheet. Since we had not yet conducted any reconnaissance of the area on foot, we did not know where we could walk and safely avoid crevasses and abandoned moulins. This left us confined to camp for the first week, mostly sitting in the group tent and fretting about the work that was not getting done. Finally, after a week of waiting, enough snow had melted, and enough stir craziness accumulated, that we decided to conduct a first recon to attempt to locate the newly formed moulin that we had identified from the helicopter.
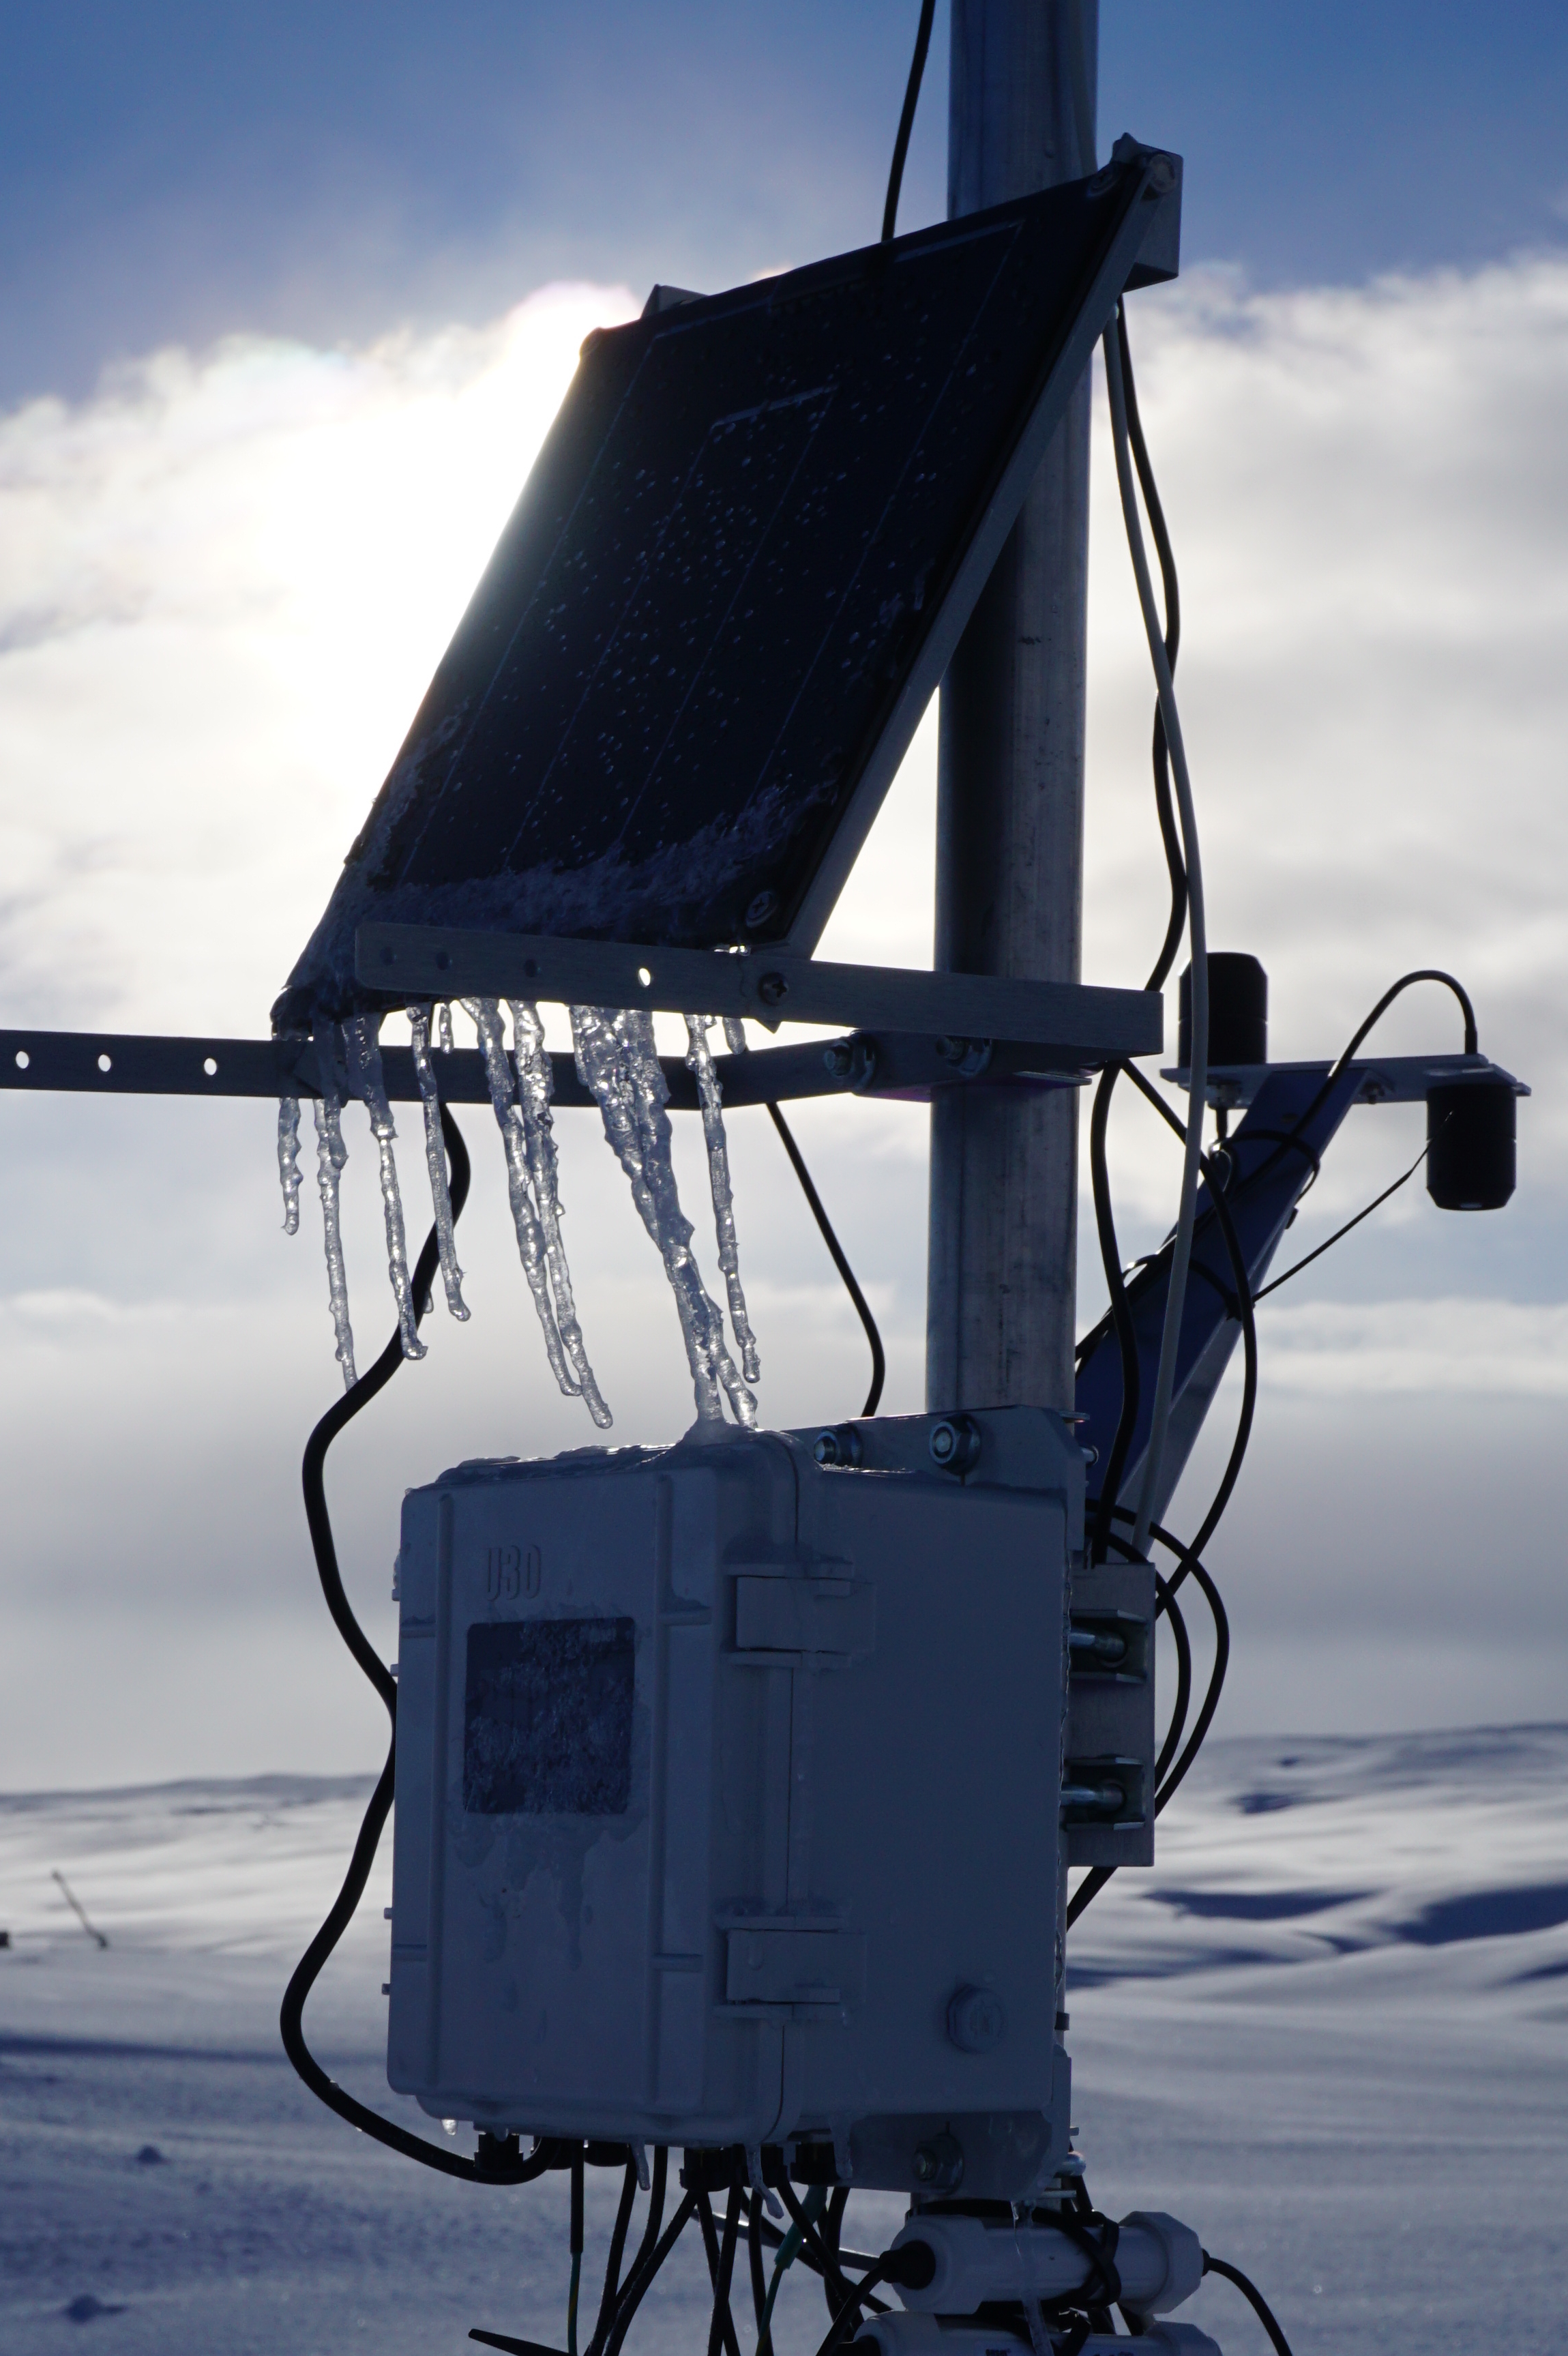
We awoke to 30 cm of freshly fallen snow on our first morning in camp.The drifting continued.The only instrumentation we were able to install in the first week was our weather station., which was located in camp. Here you can see that the weather station is telling us it’s cold.
https://youtu.be/v4tklygRm64
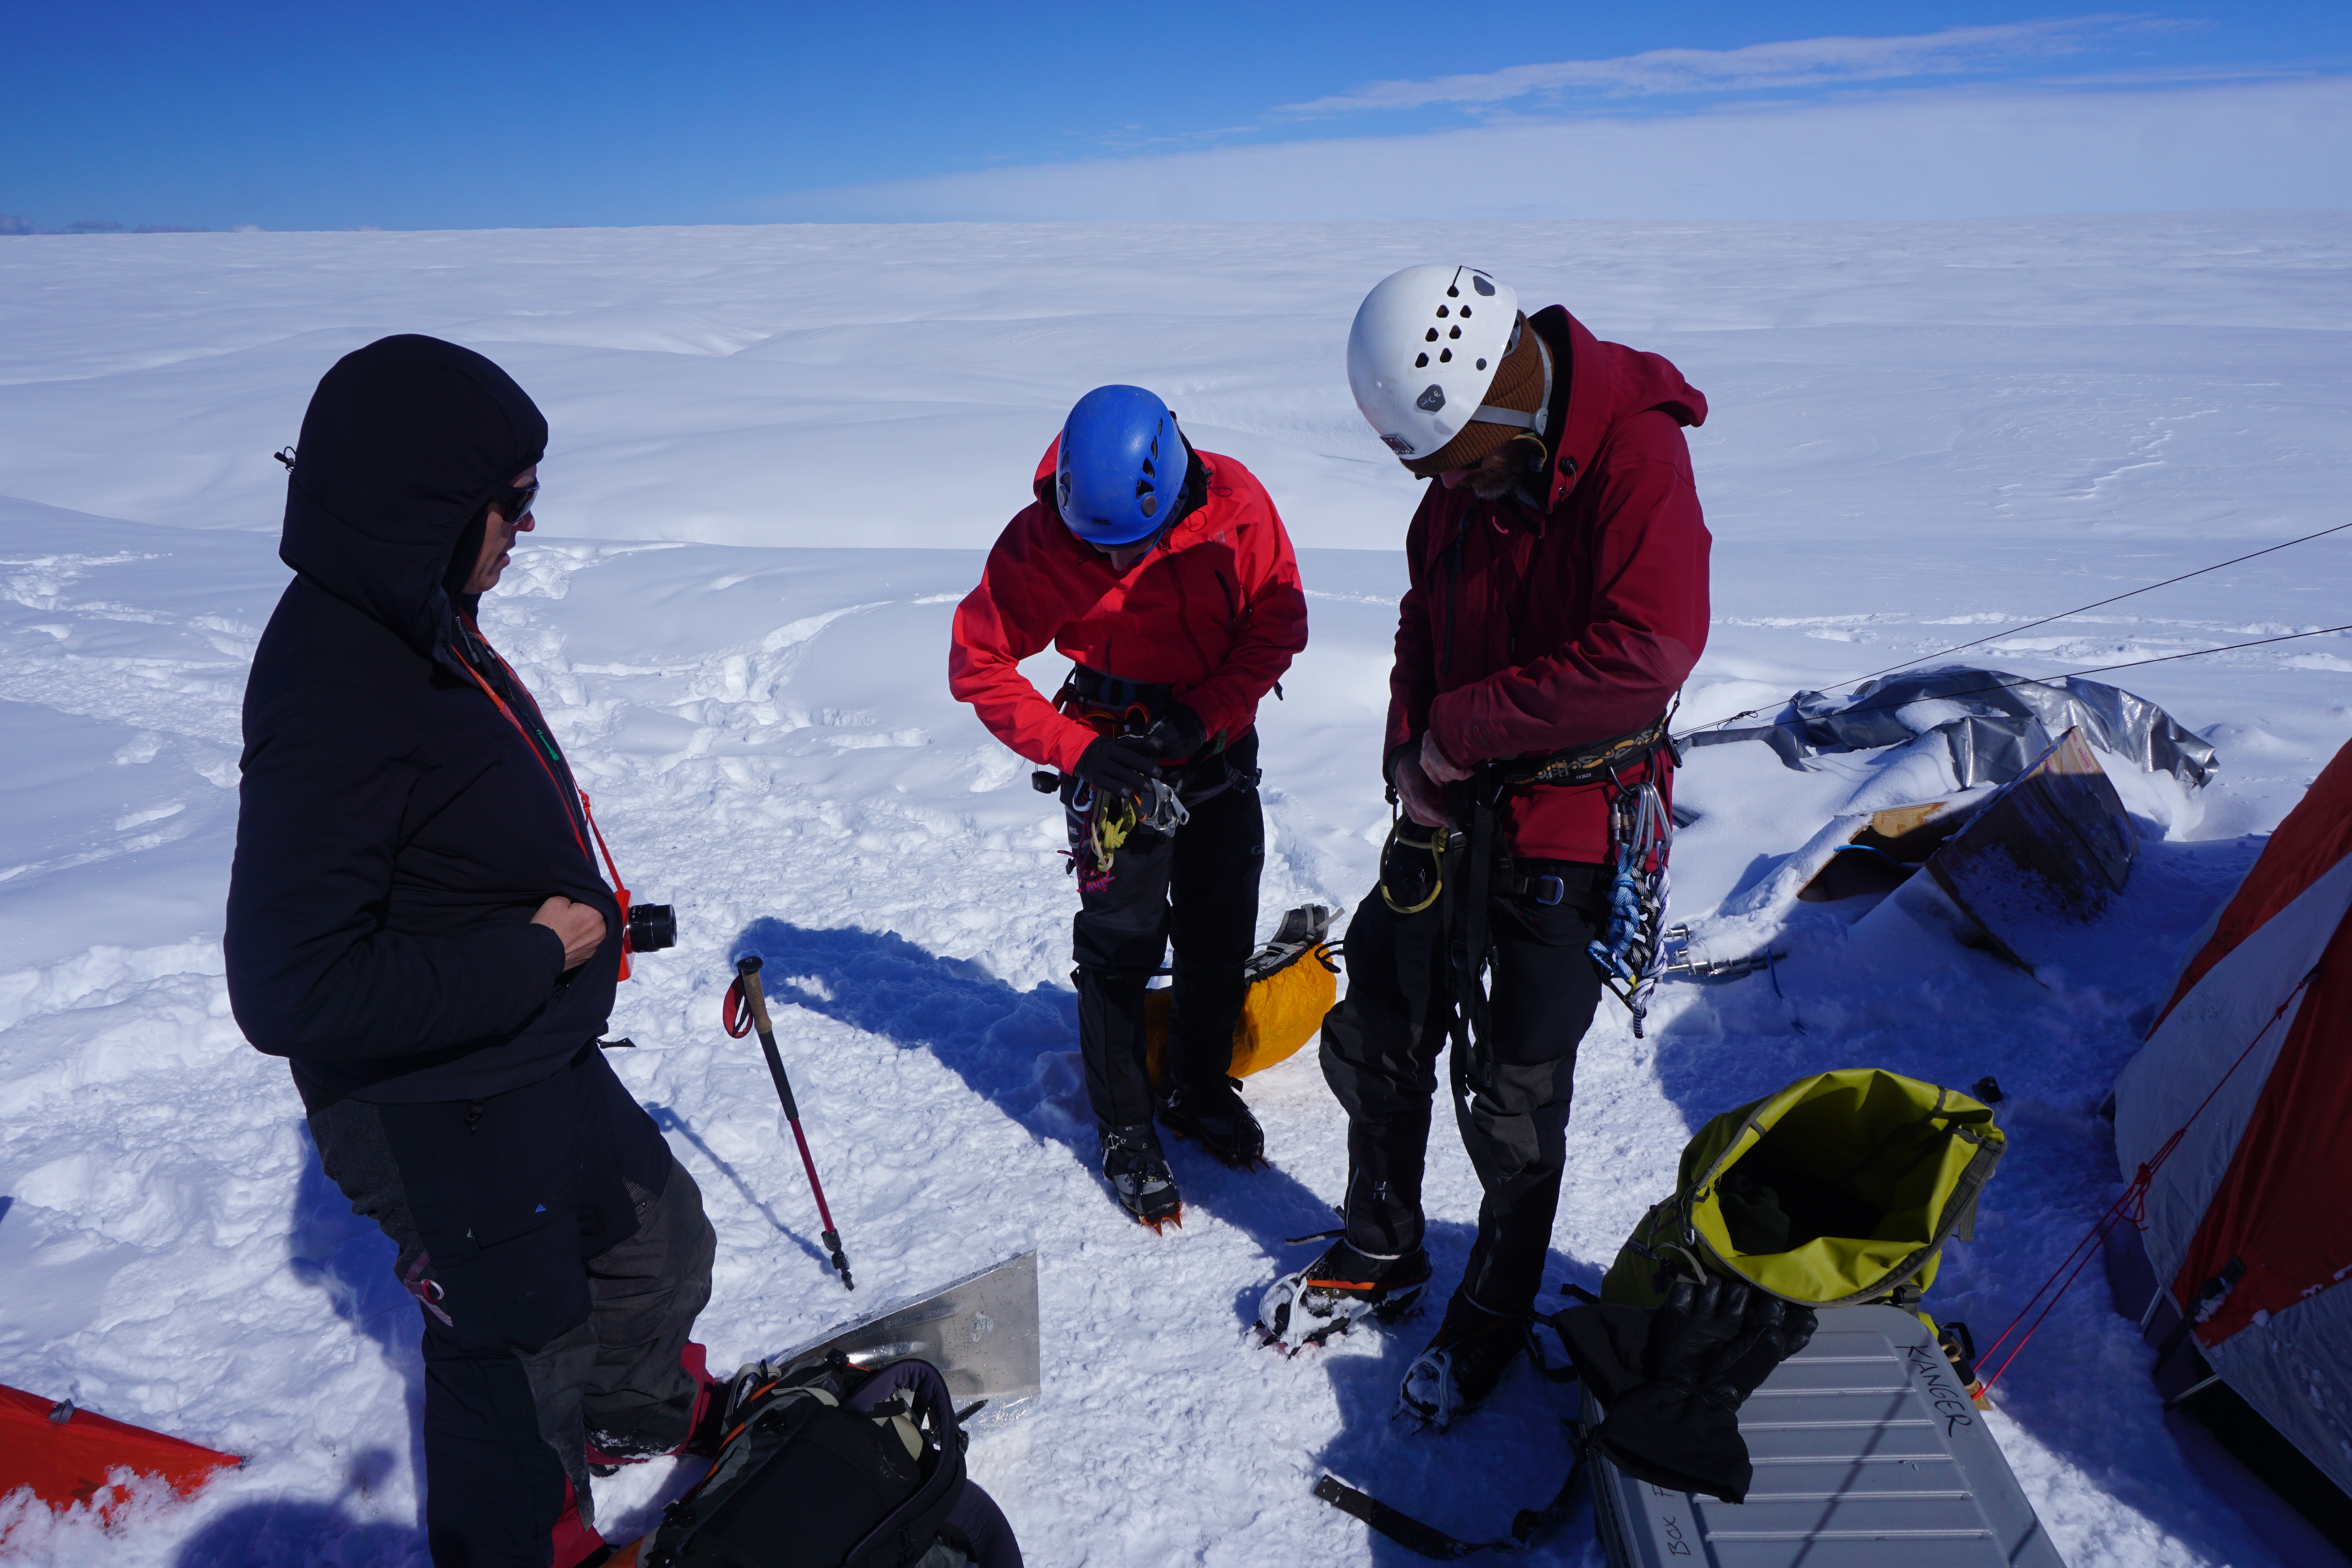
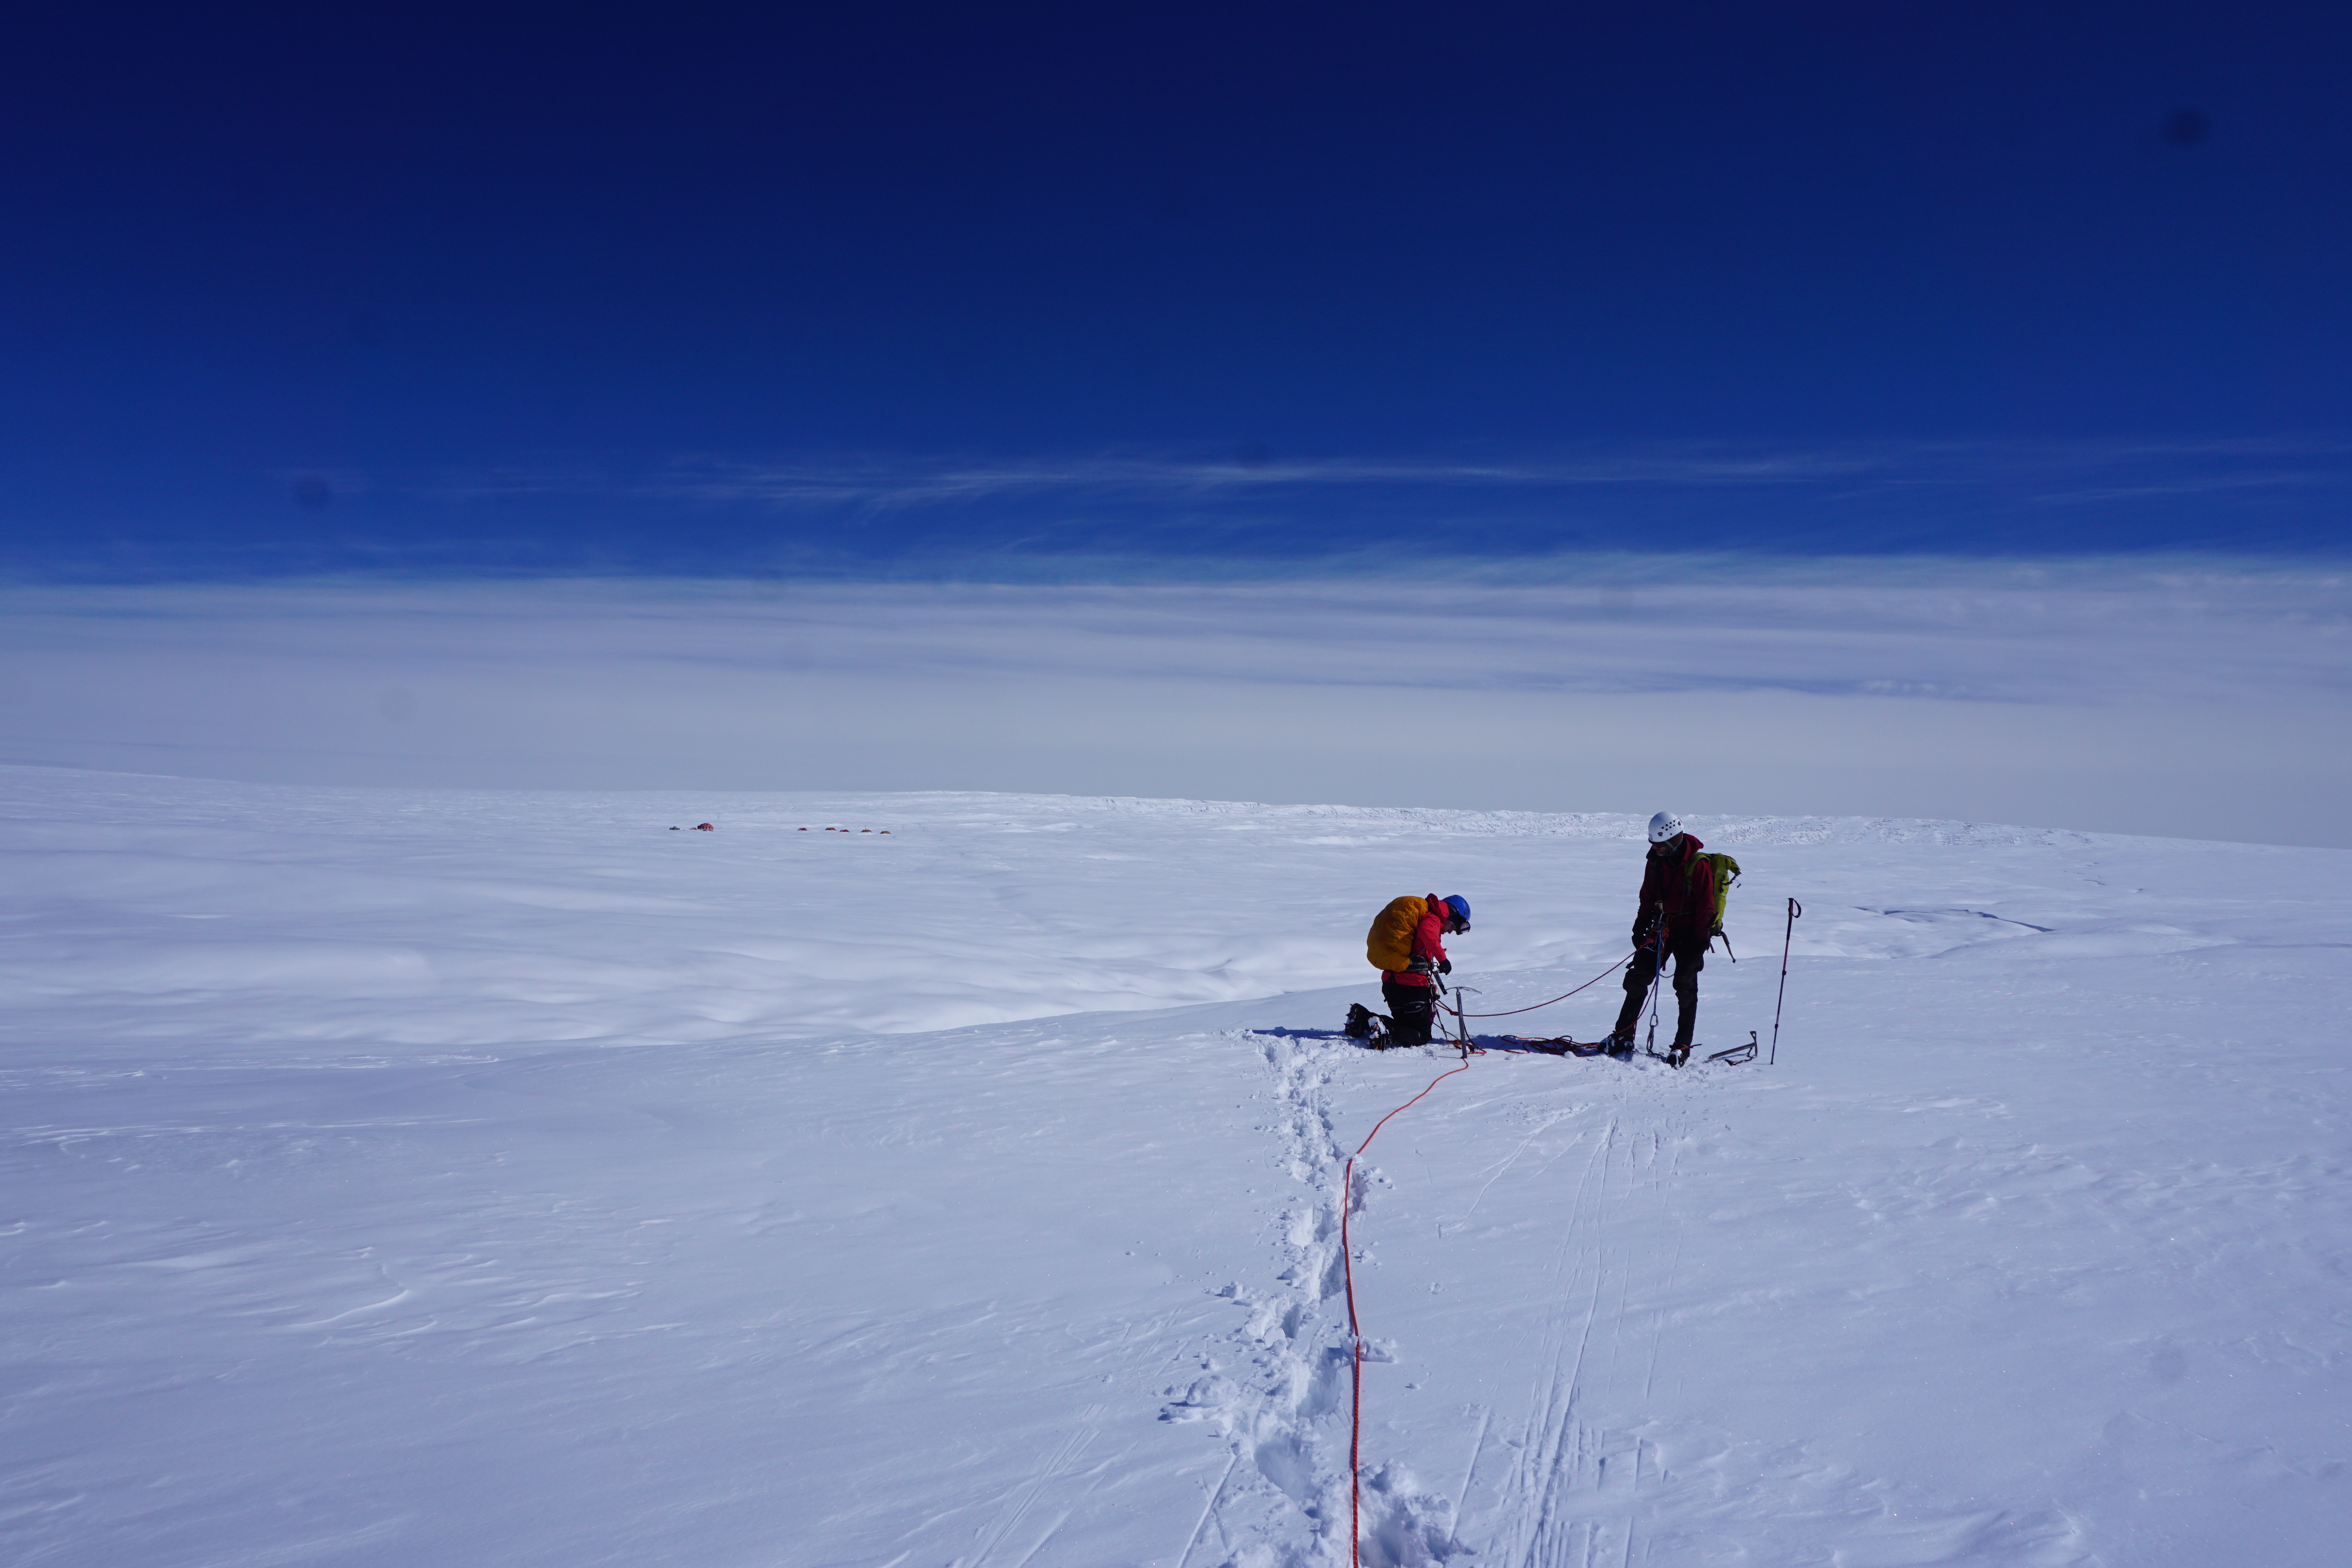
Gearing up for our first recon out of camp.Setting an anchor to scout out a potential moulin instrumentation site. Camp is in the distance.
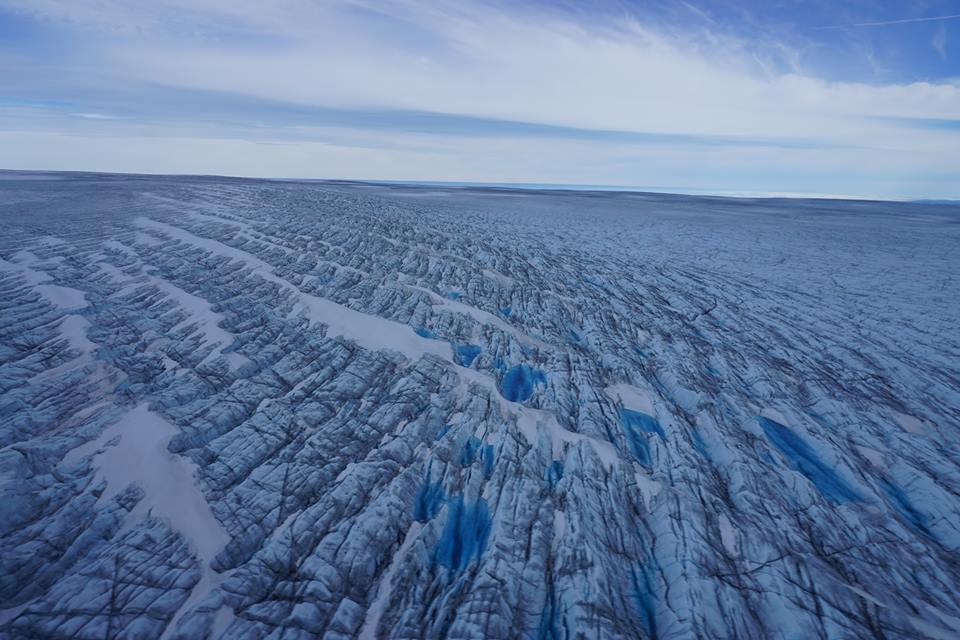
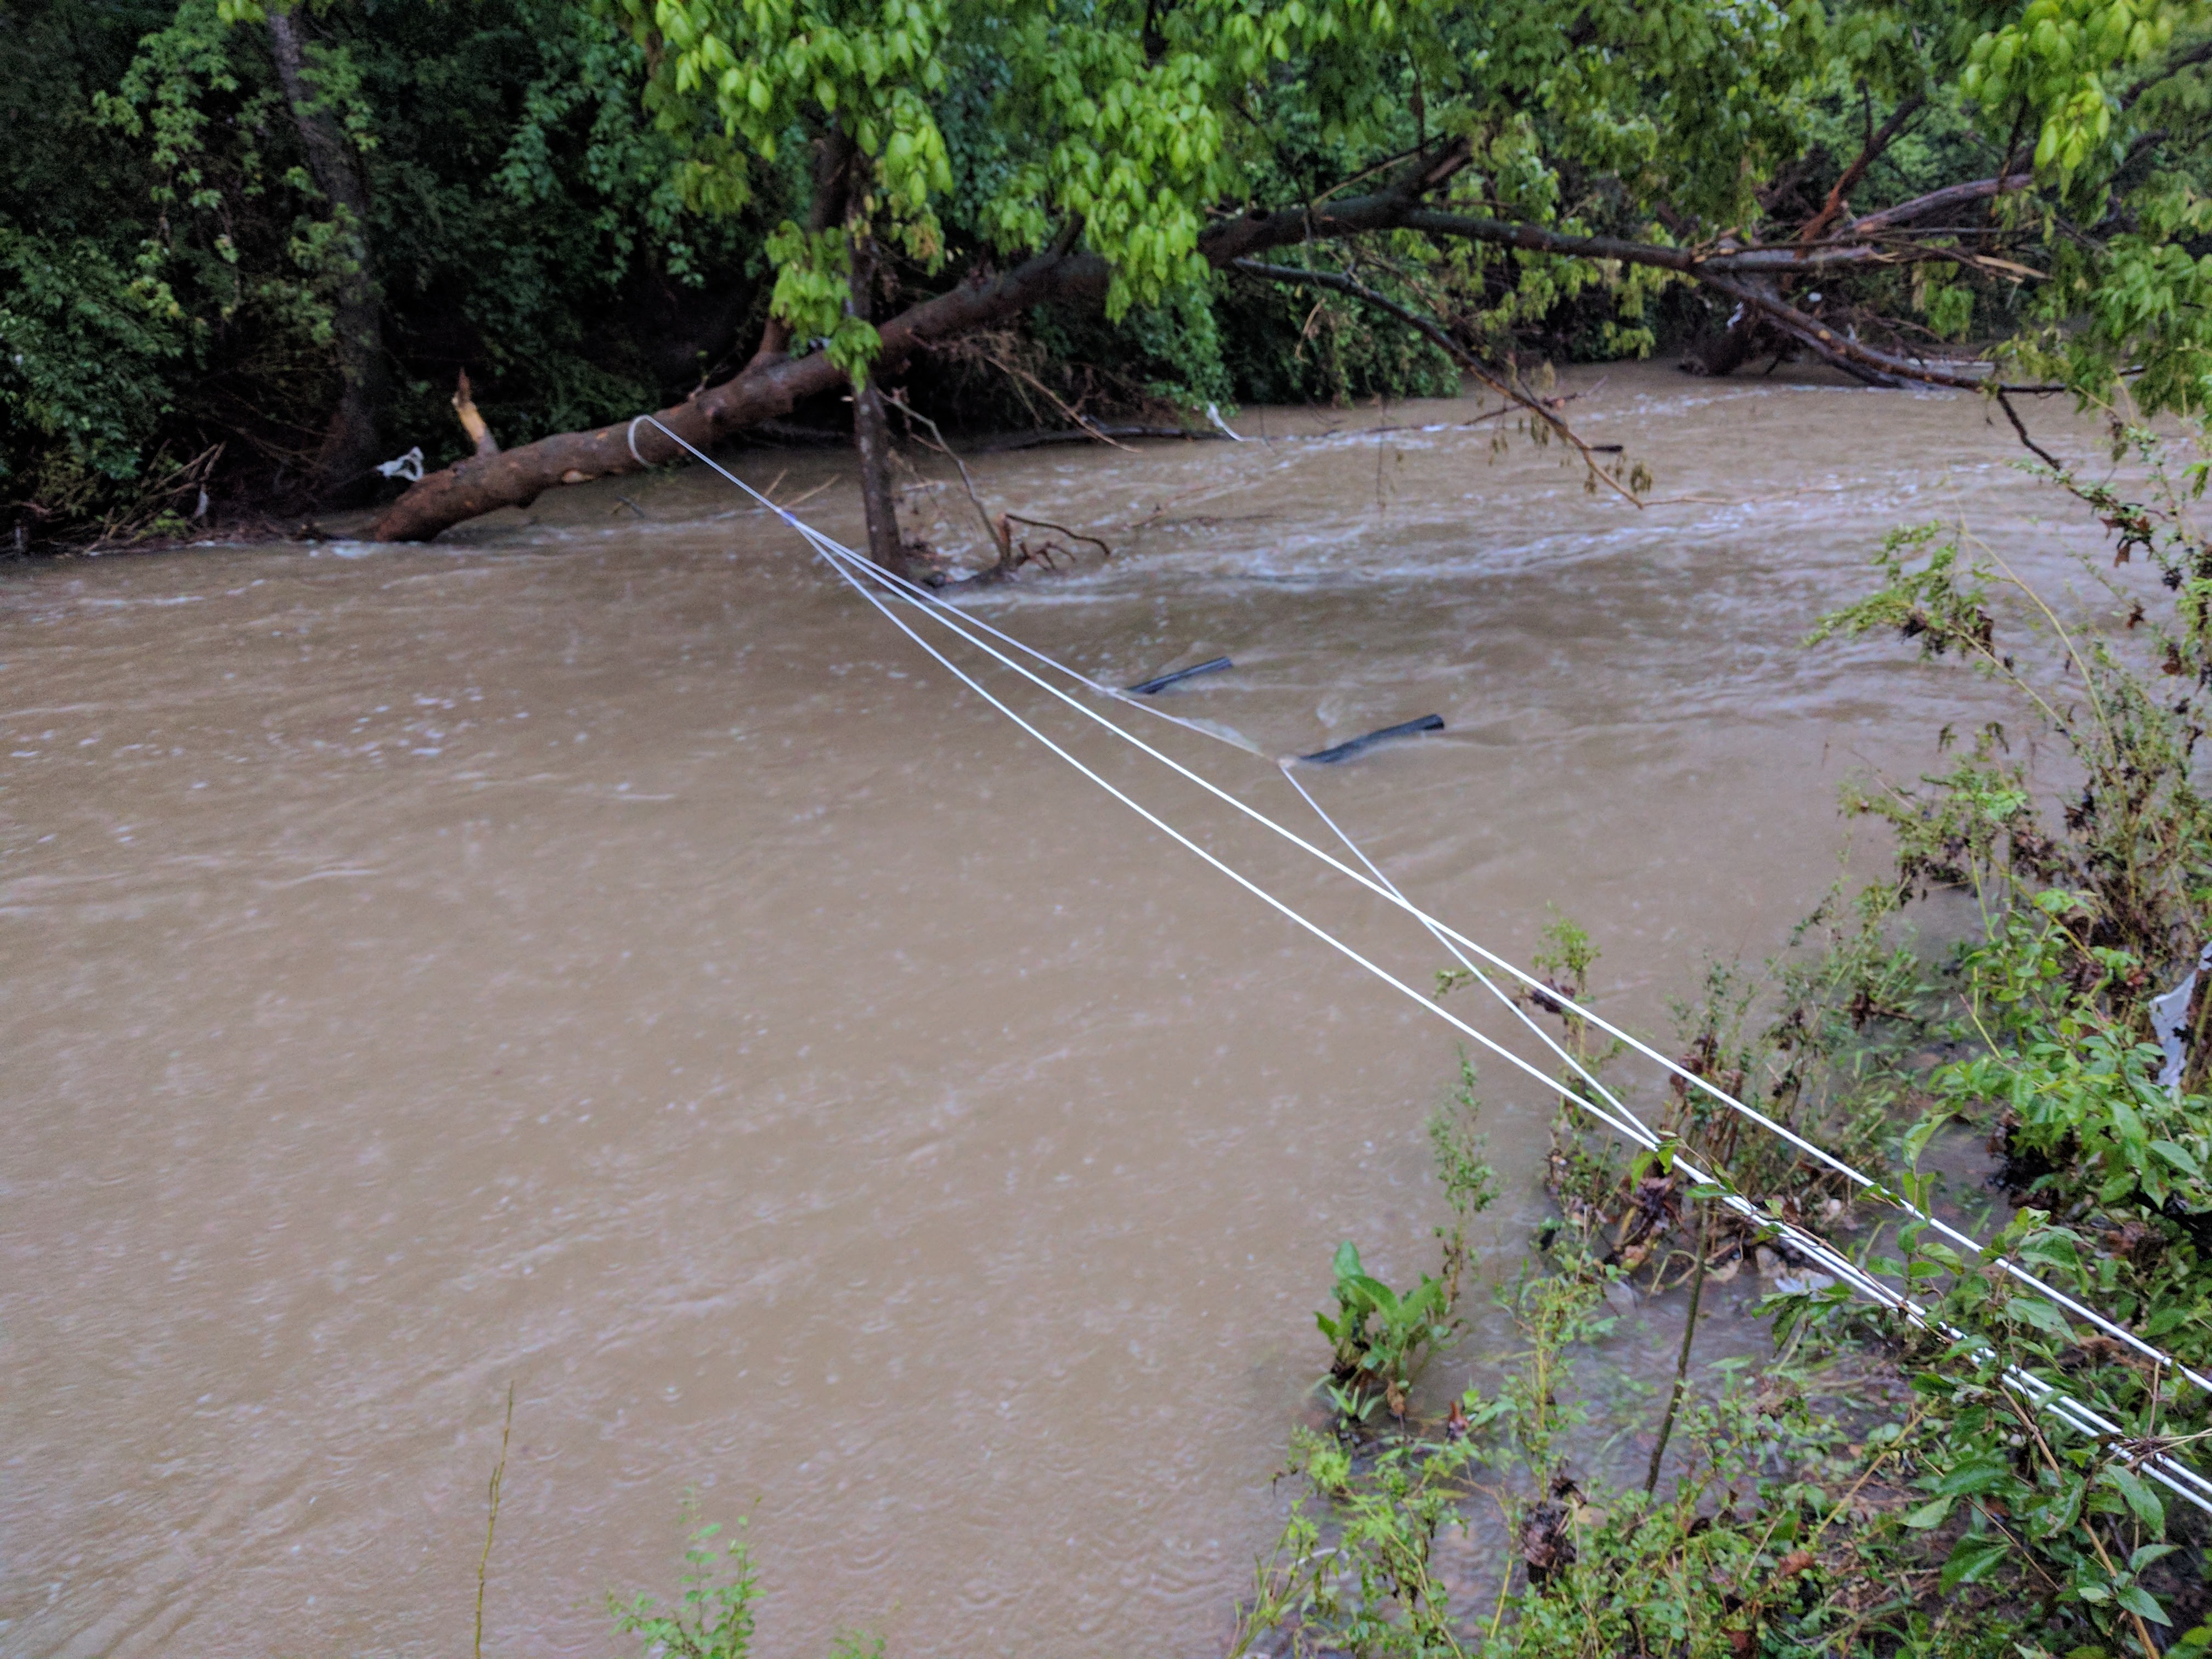
This summer my research group, in collaboration with Jason Gulley and Tim Dixon at University of South Florida, conducted field work on the Greenland Ice Sheet. We were studying the relationships between meltwater and ice motion. Meltwater produced on the ice surface gathers in stream networks, most of which terminate at holes in the ice called moulins. Moulins are deep vertical shafts that lead to the bottom of the ice. The water passes through these moulins and into flow paths beneath the ice before ultimately flowing out from under the terminus of the glacier. Prior work has shown that increasing injection of meltwater beneath the ice, which is predicted in warming climate, can result in faster sliding motion of the ice, leading to more rapid decline in total ice sheet mass. The sliding rates increase because the water can buoyantly lift up the ice and reduce the friction at the base. However, if an efficient drainage system develops beneath the ice, this can once again lower water pressures and reduce sliding speed. The goal of our project is to collect simultaneous measurements of meltwater injection, moulin water pressures, and ice motion, which will help to improve our understanding of how these processes work and ultimately increase the accuracy of projections for future sea level rise.
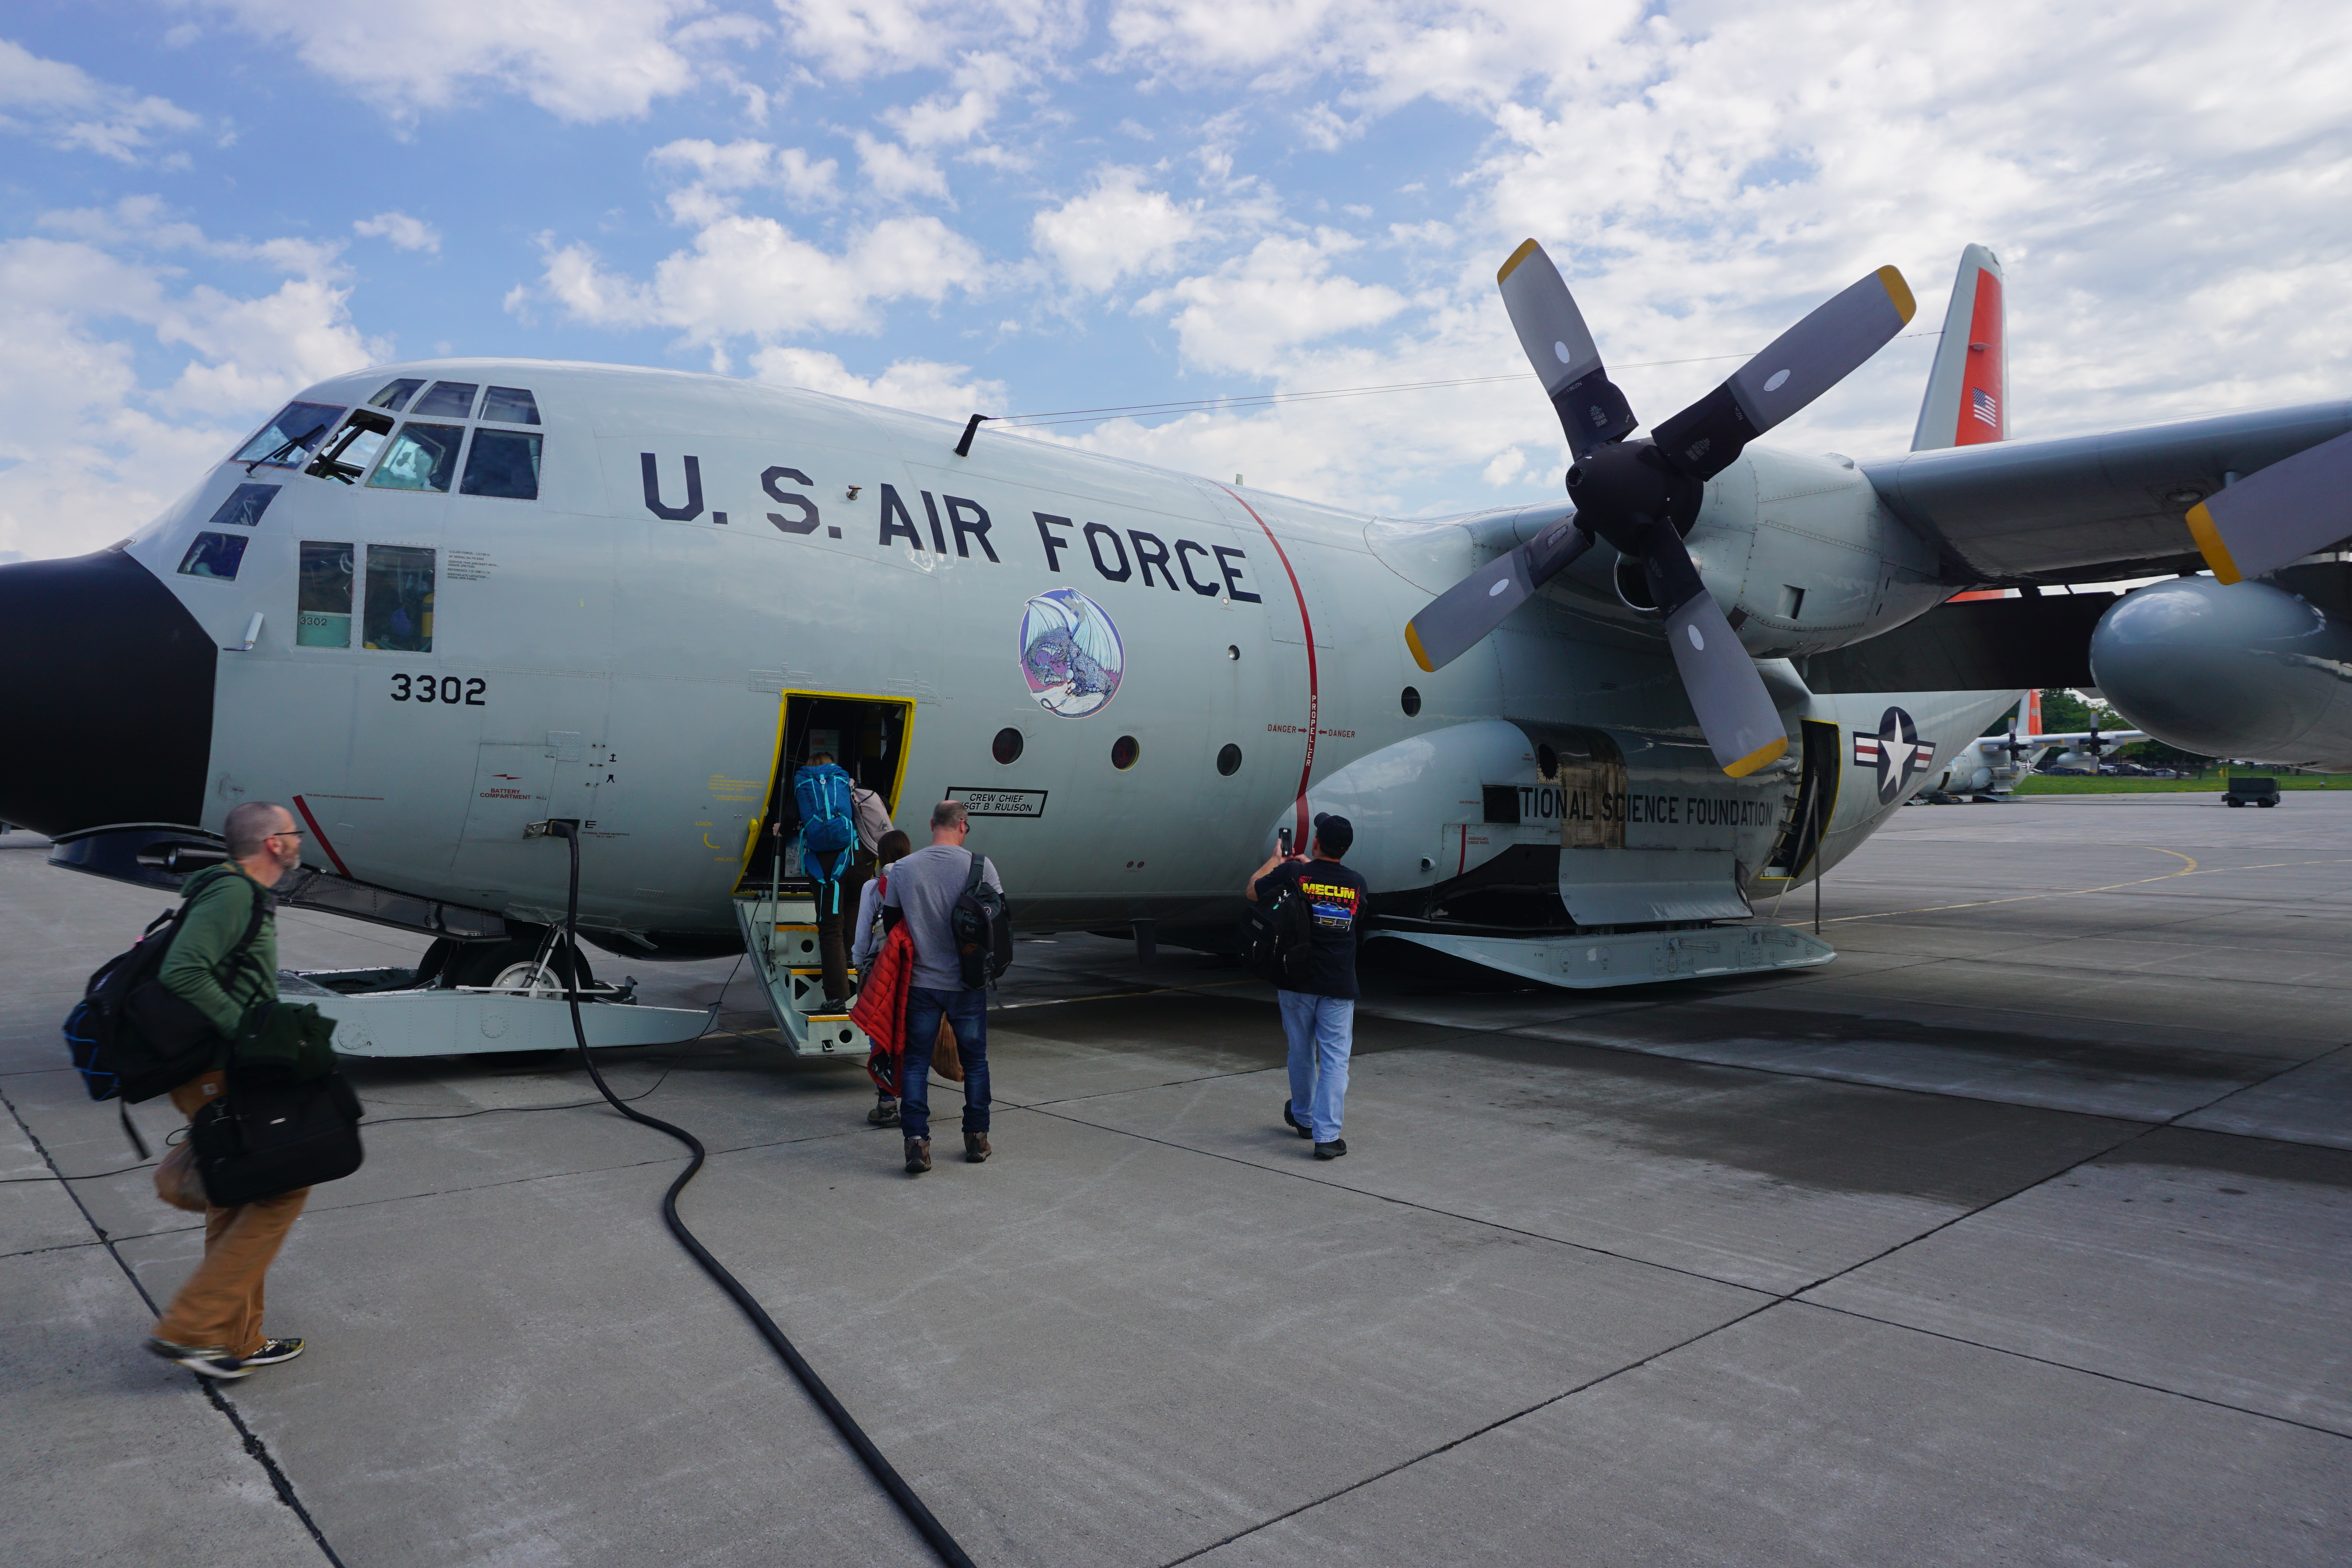
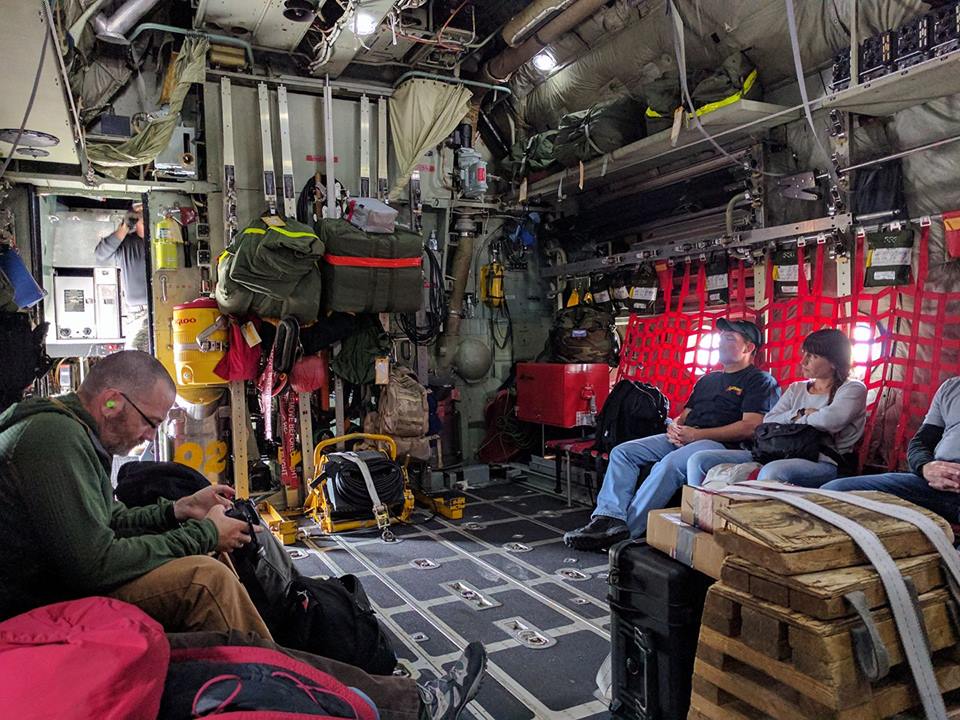
Boarding the NSF/Air National Guard flight to Kanger from Albany.Inside the C-130 prepping for our flight.
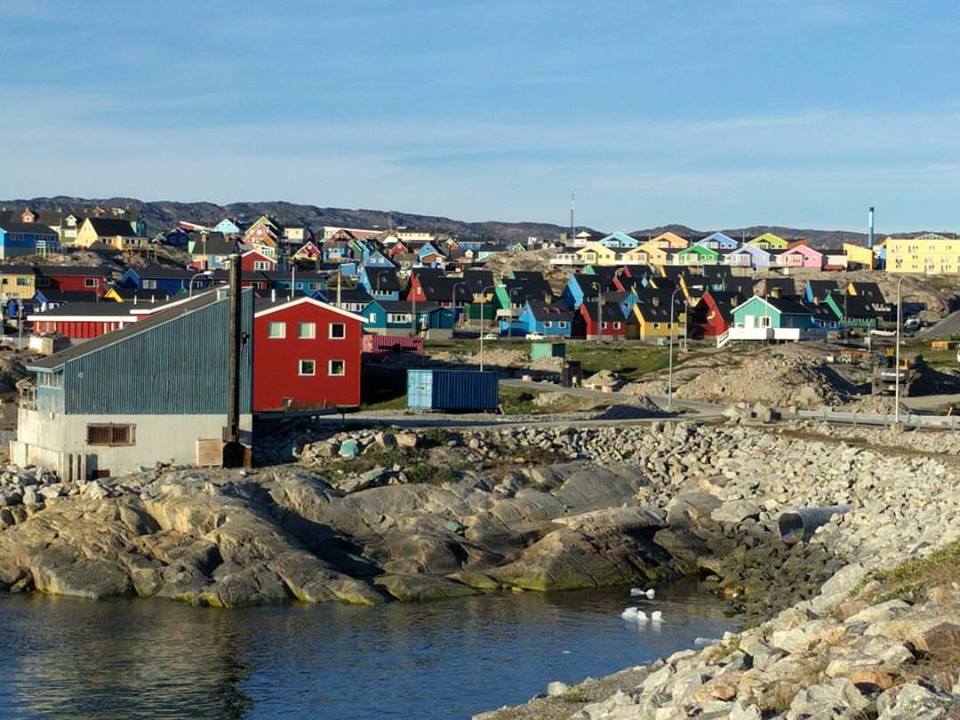
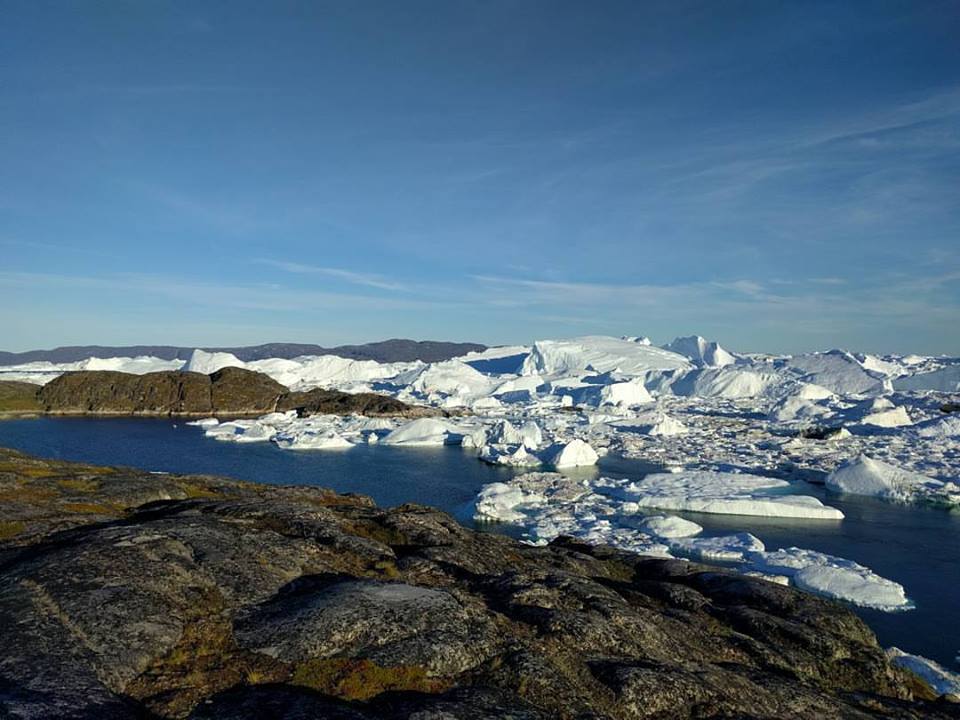
Conducting fieldwork on the Greenland Ice Sheet involves some substantial logistical hurdles. For transportation to Greenland, the National Science Foundation has an agreement with the Air National Guard to fly scientists and scientific cargo to Greenland using C-130s. We sent most of our equipment to Greenland in the spring. Then, in late June, we flew to Albany, NY where we got our C-130 airlift to Kangerlussuaq, Greenland. After a couple of days in Kanger, we flew on to Ilulissat, which was the closest town to where we would be working and is one of the best places in Greenland to see icebergs.
Colorful houses in Ilulissat, Greenland.
City block sized icebergs in the icefjord. Note the boat (white speck on left) for scale.
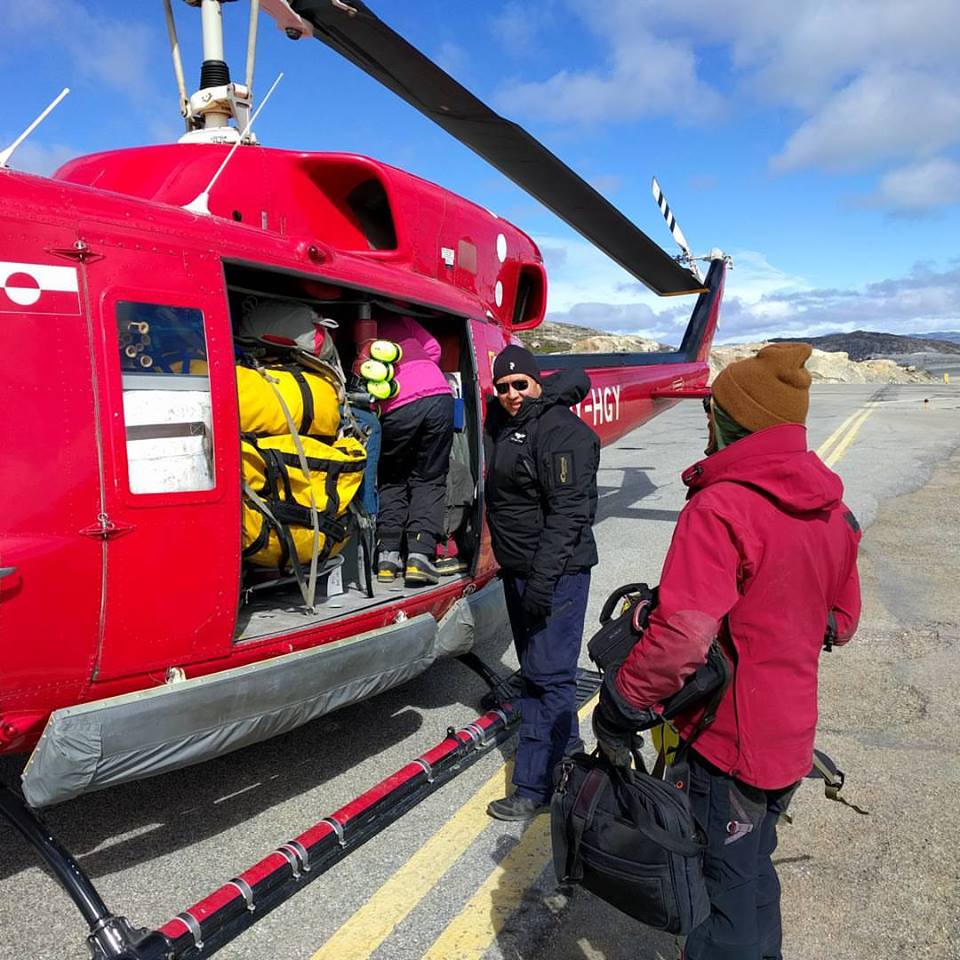
After nearly a week of organizing gear and preparing for our camp on the ice, we needed three helicopter flights to transport our 5000 lbs of gear and five team members out onto the ice.
Then the helicopter flew away, and left us to settle into our home for the next month.
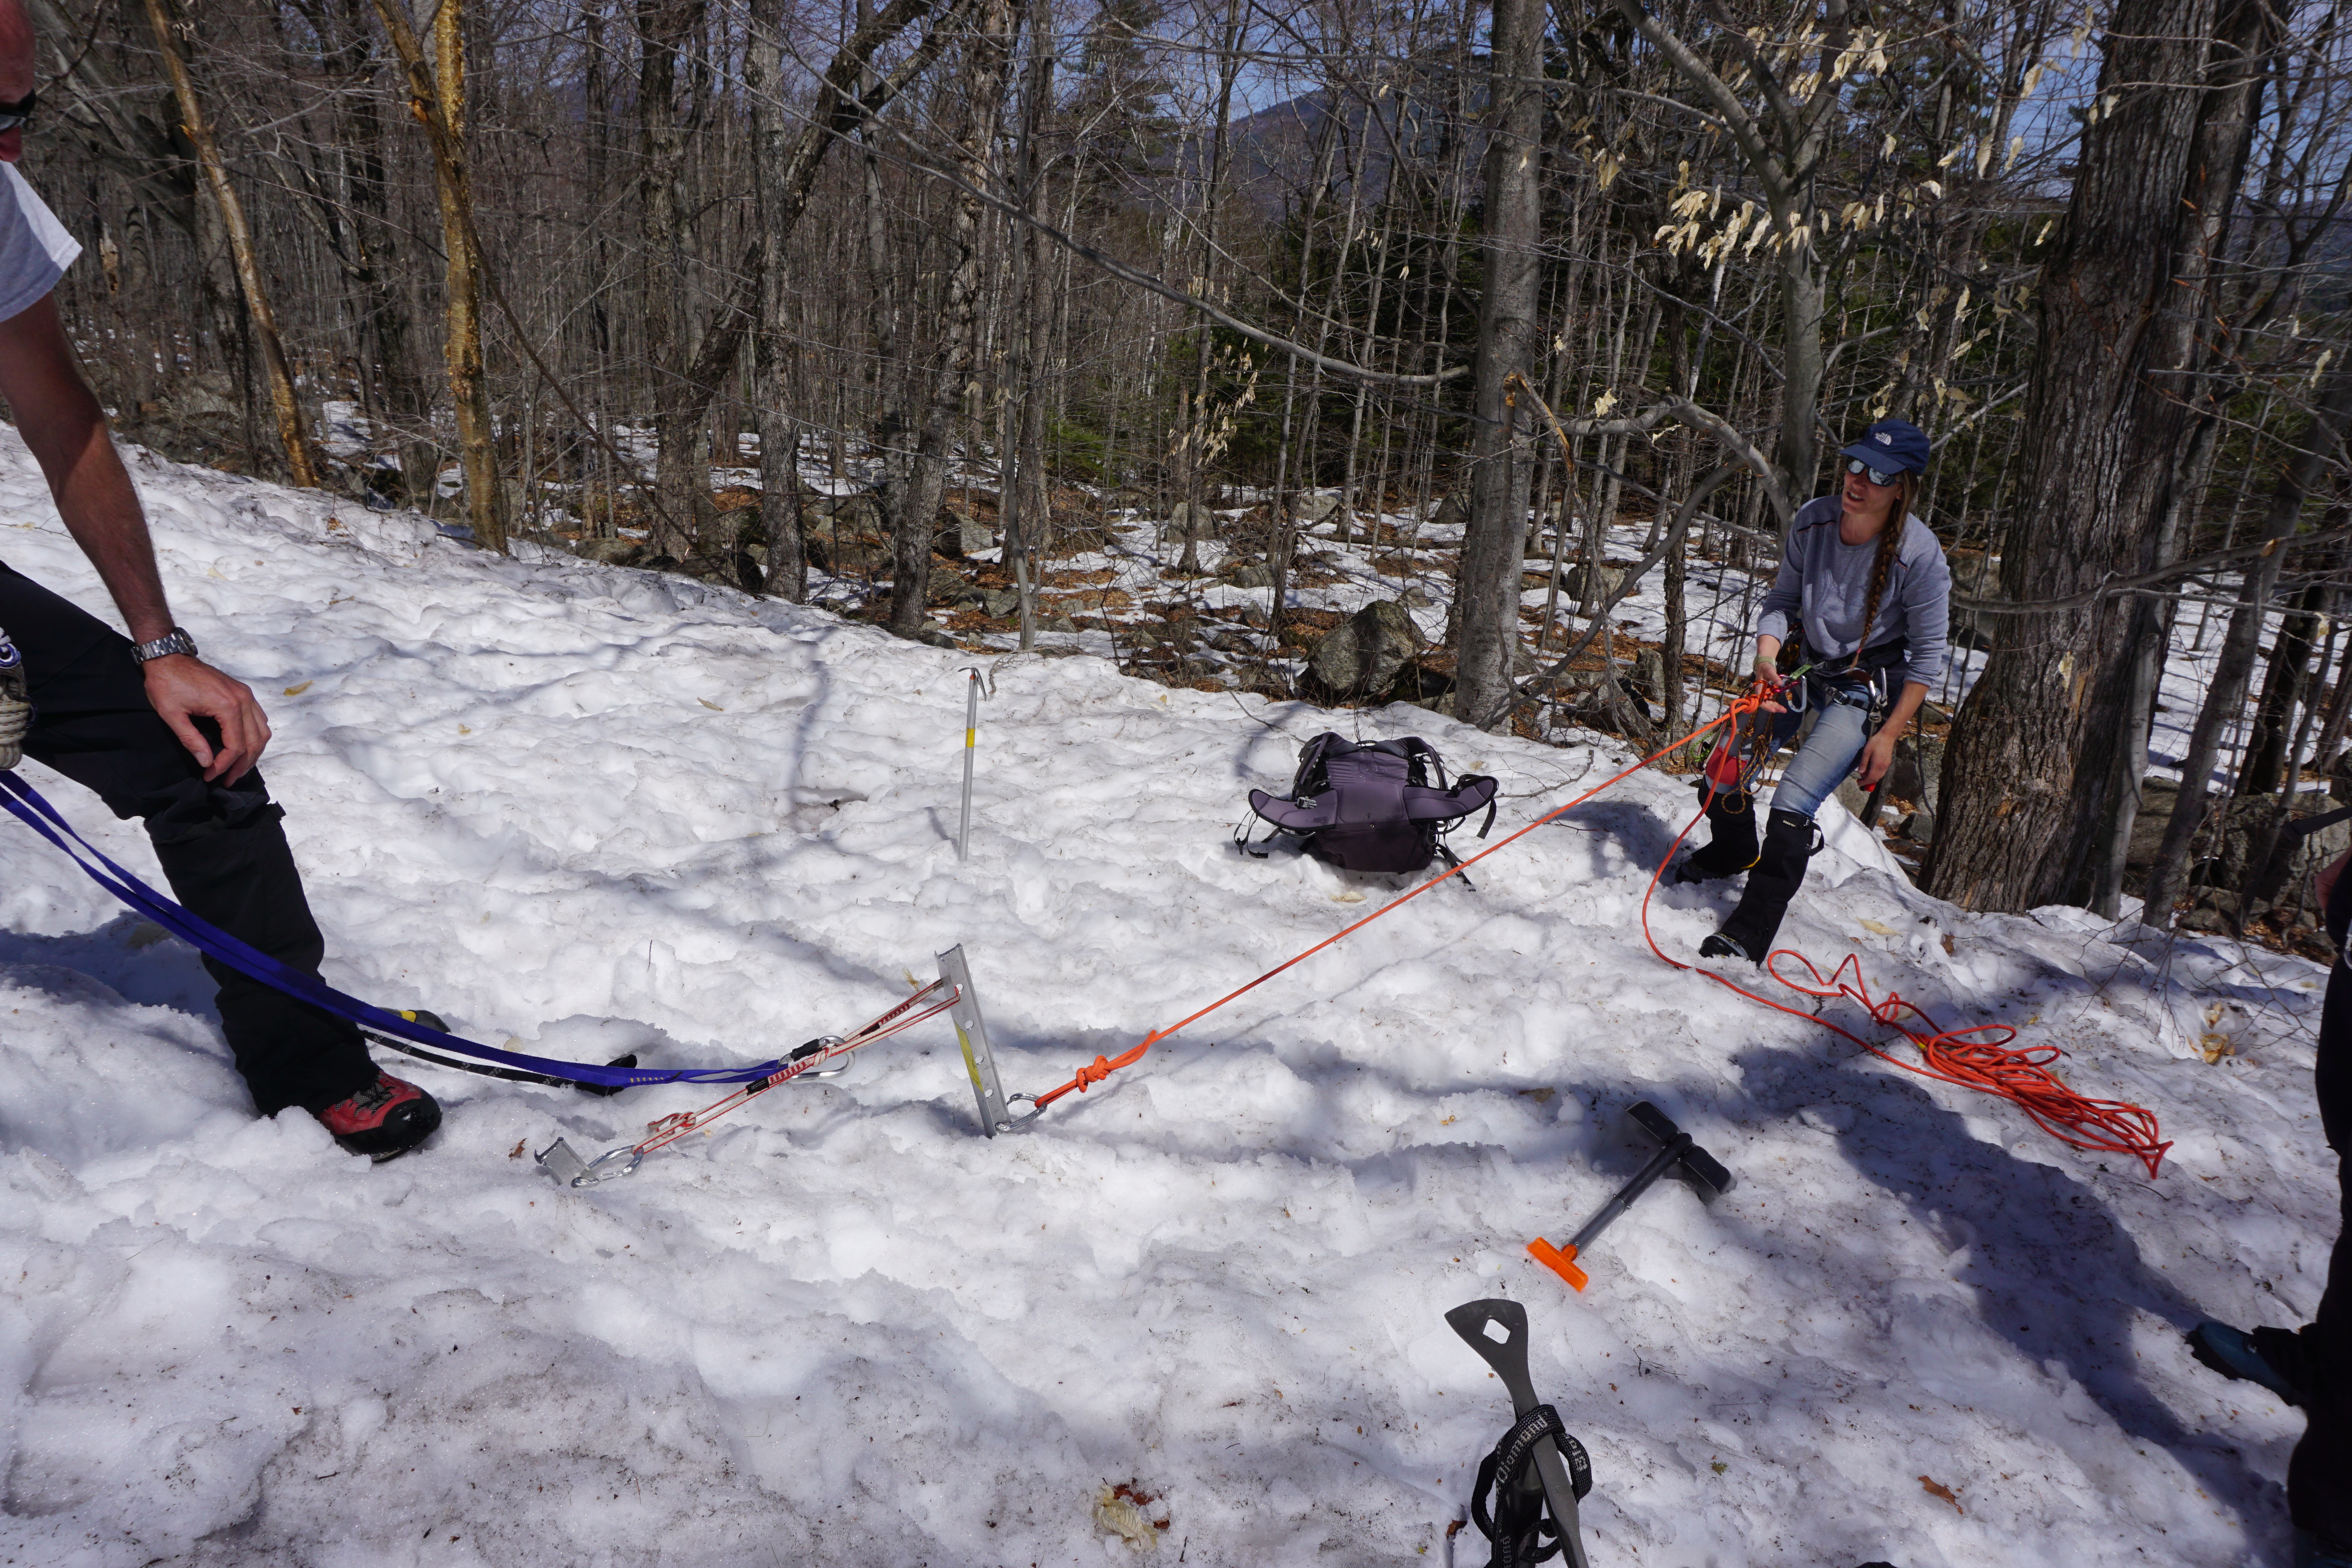
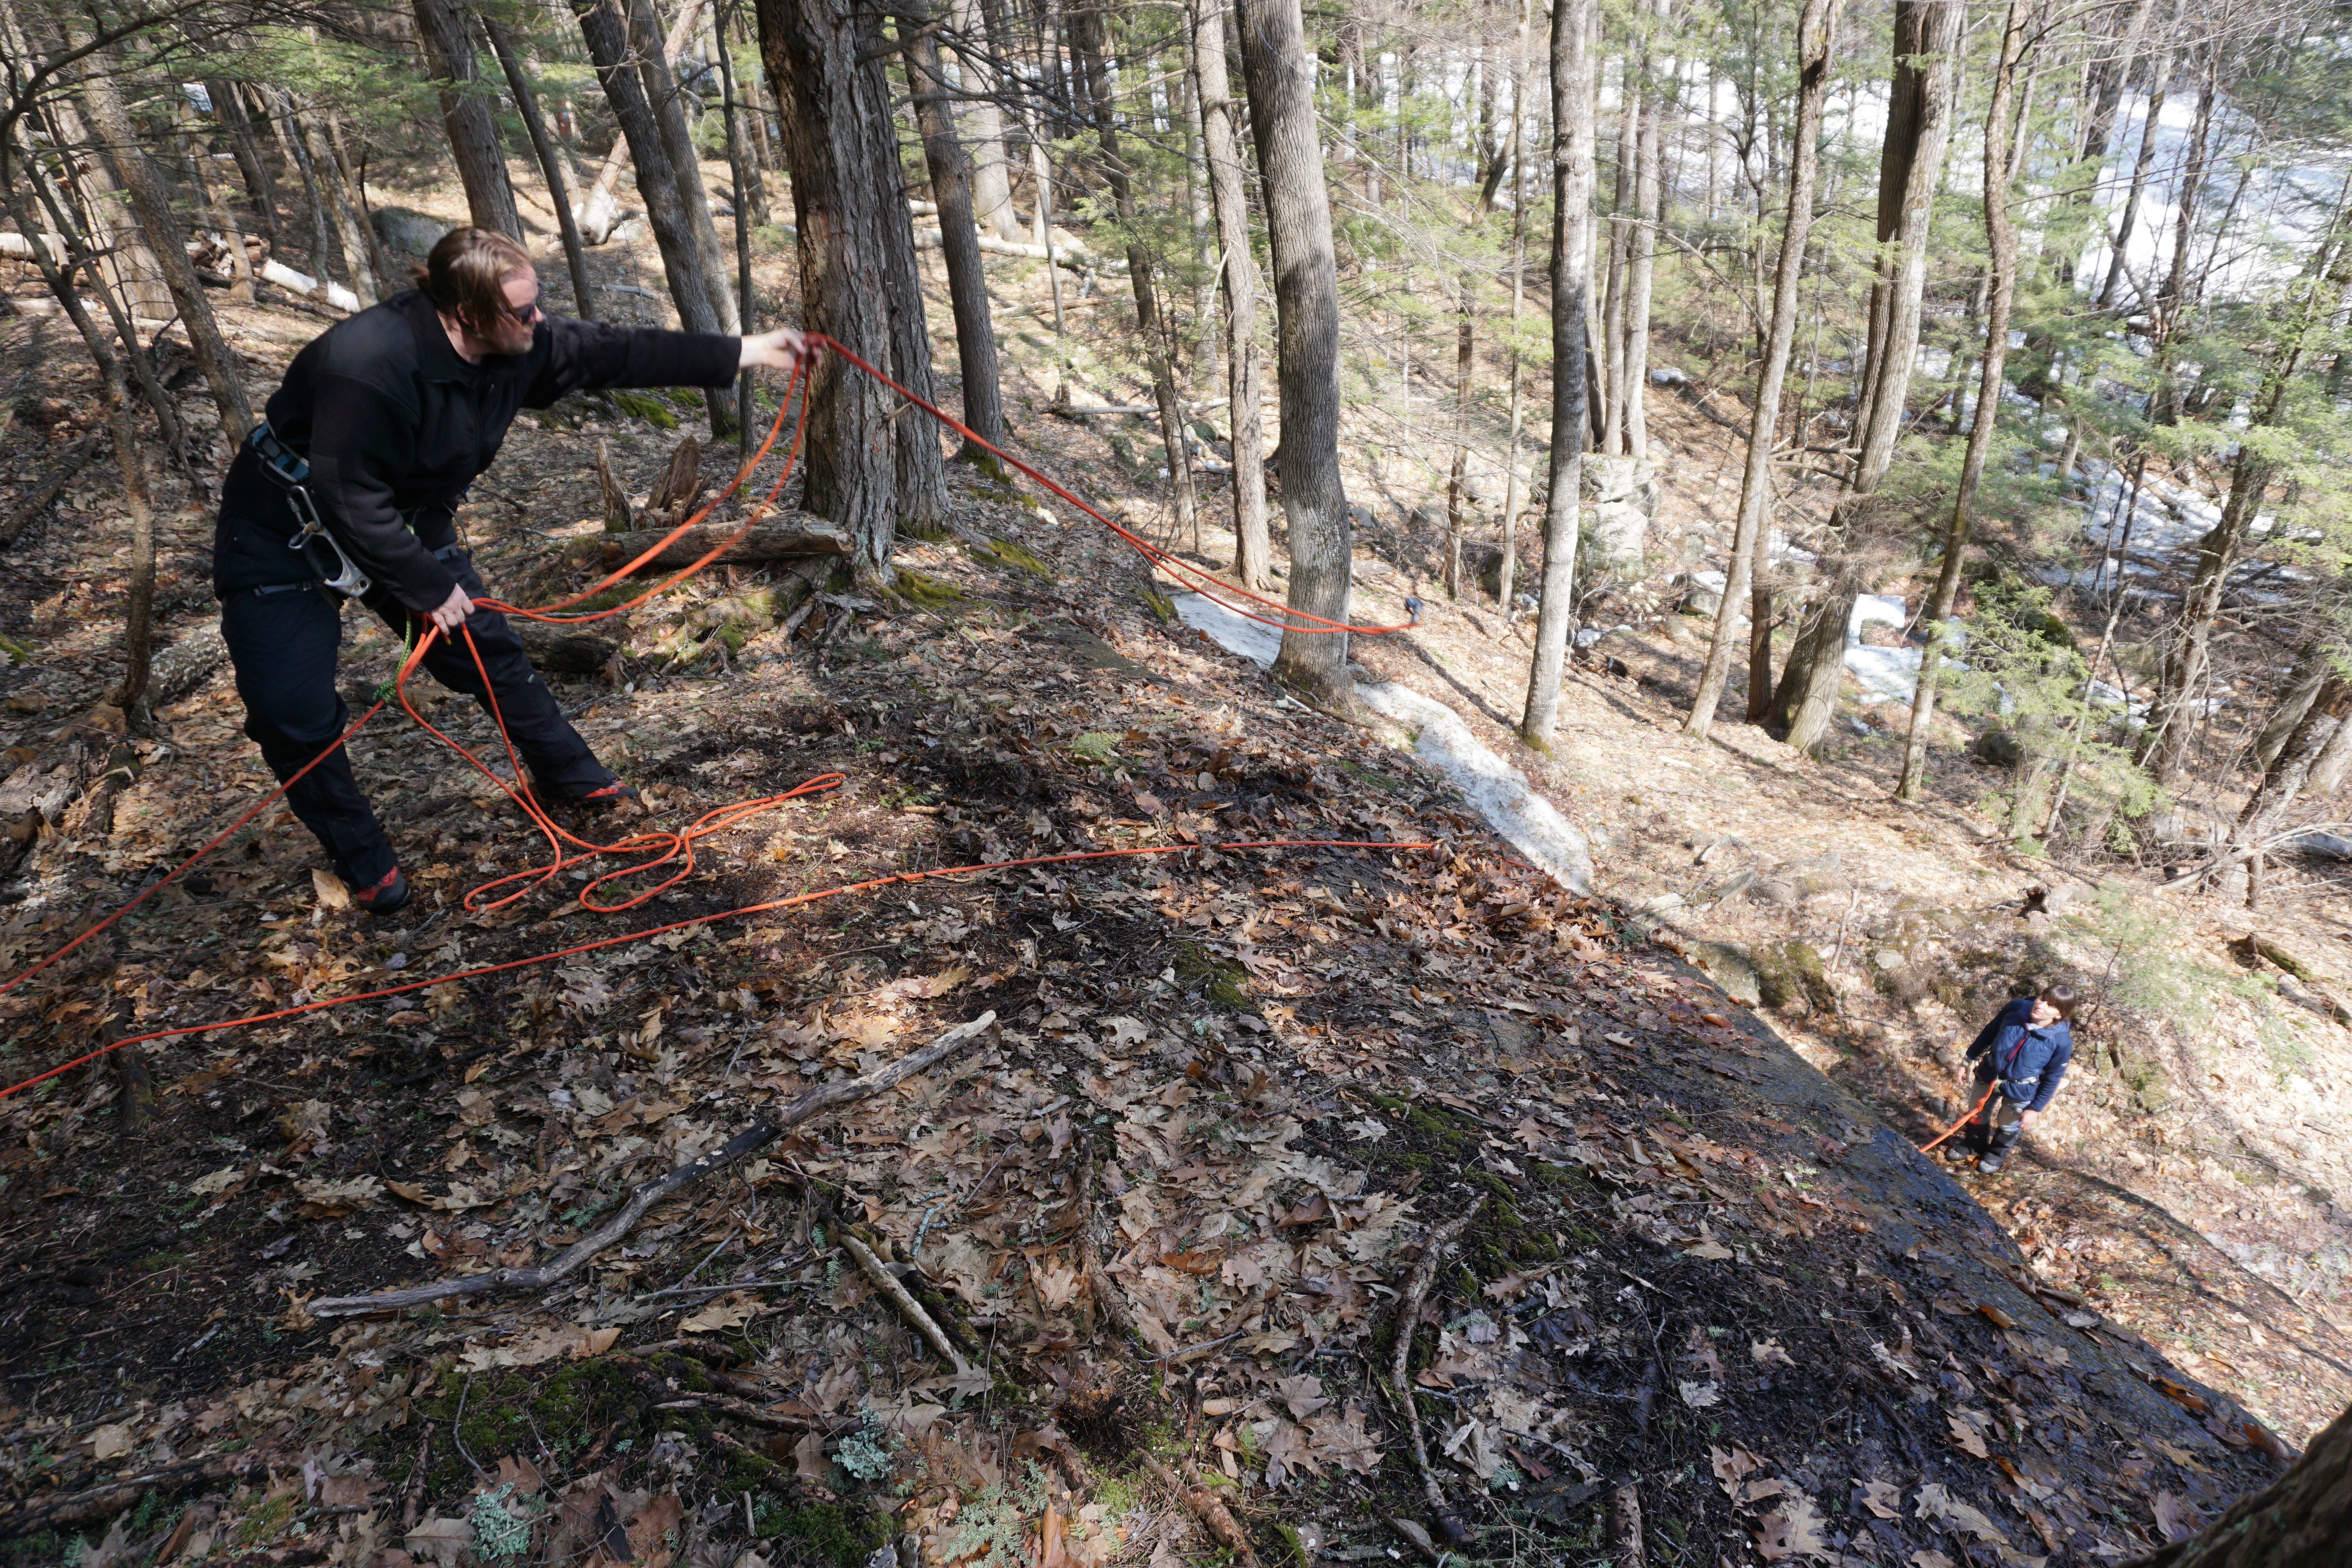
As part of our preparation for summer field work in Greenland, we took part in a 2-day Glacier Travel course at the International Mountain Climbing School in North Conway, New Hampshire. In the course, our team learned the basics of roped glacier travel and crevasse rescue.
Testing a snow anchor in the rapidly melting spring New Hampshire snow.Preparing to haul a team member out of a “crevasse.”
This spring semester we began preparations for upcoming fieldwork on the Greenland Ice Sheet, supported by an NSF project in collaboration with Jason Gulley at USF. The goal of the project is to study the links between meltwater delivery to moulins (deep holes in the surface of the ice sheet), the evolution of conduit systems within the ice, and the sliding motion of the ice sheet. When meltwater reaches the base of the ice, it can lift the ice, reduce friction, and accelerate the sliding of the ice. However, models of the processes behind these links remain relatively poorly constrained by data. To examine these links in the field, we will measure water levels within the moulins, discharge within the meltwater streams that feed the moulins, and use GPS units to record the motion of the ice.
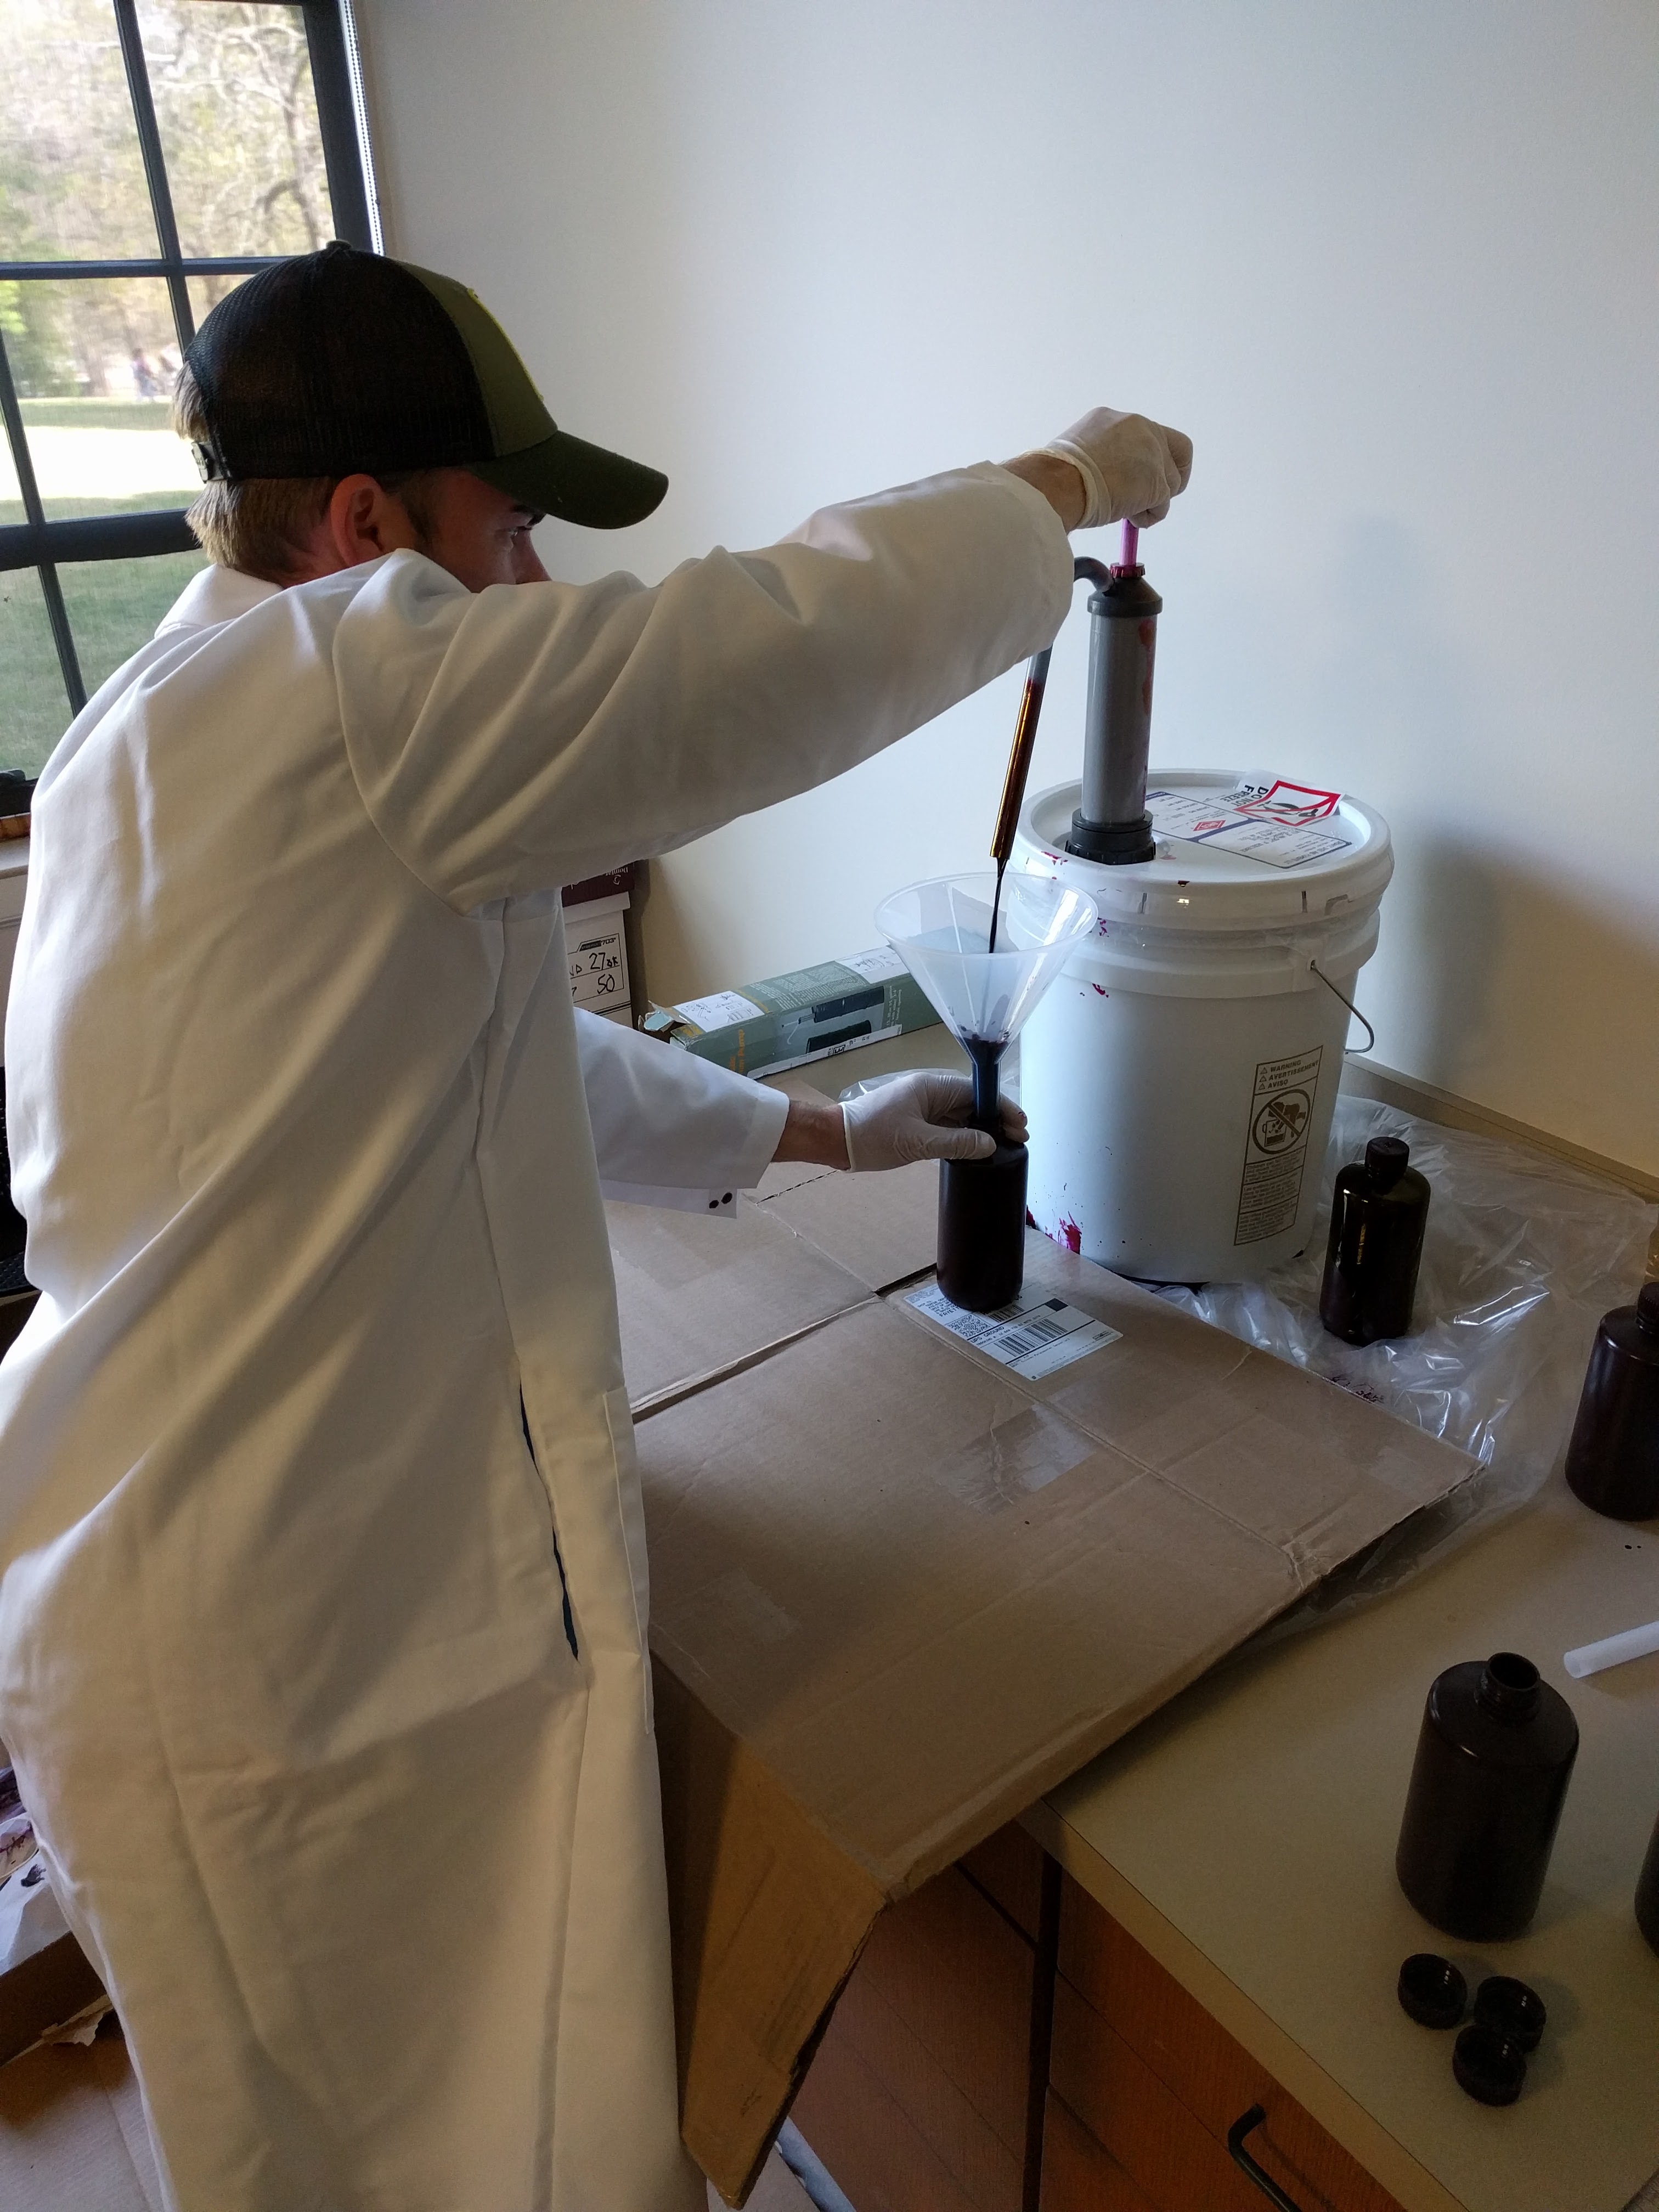
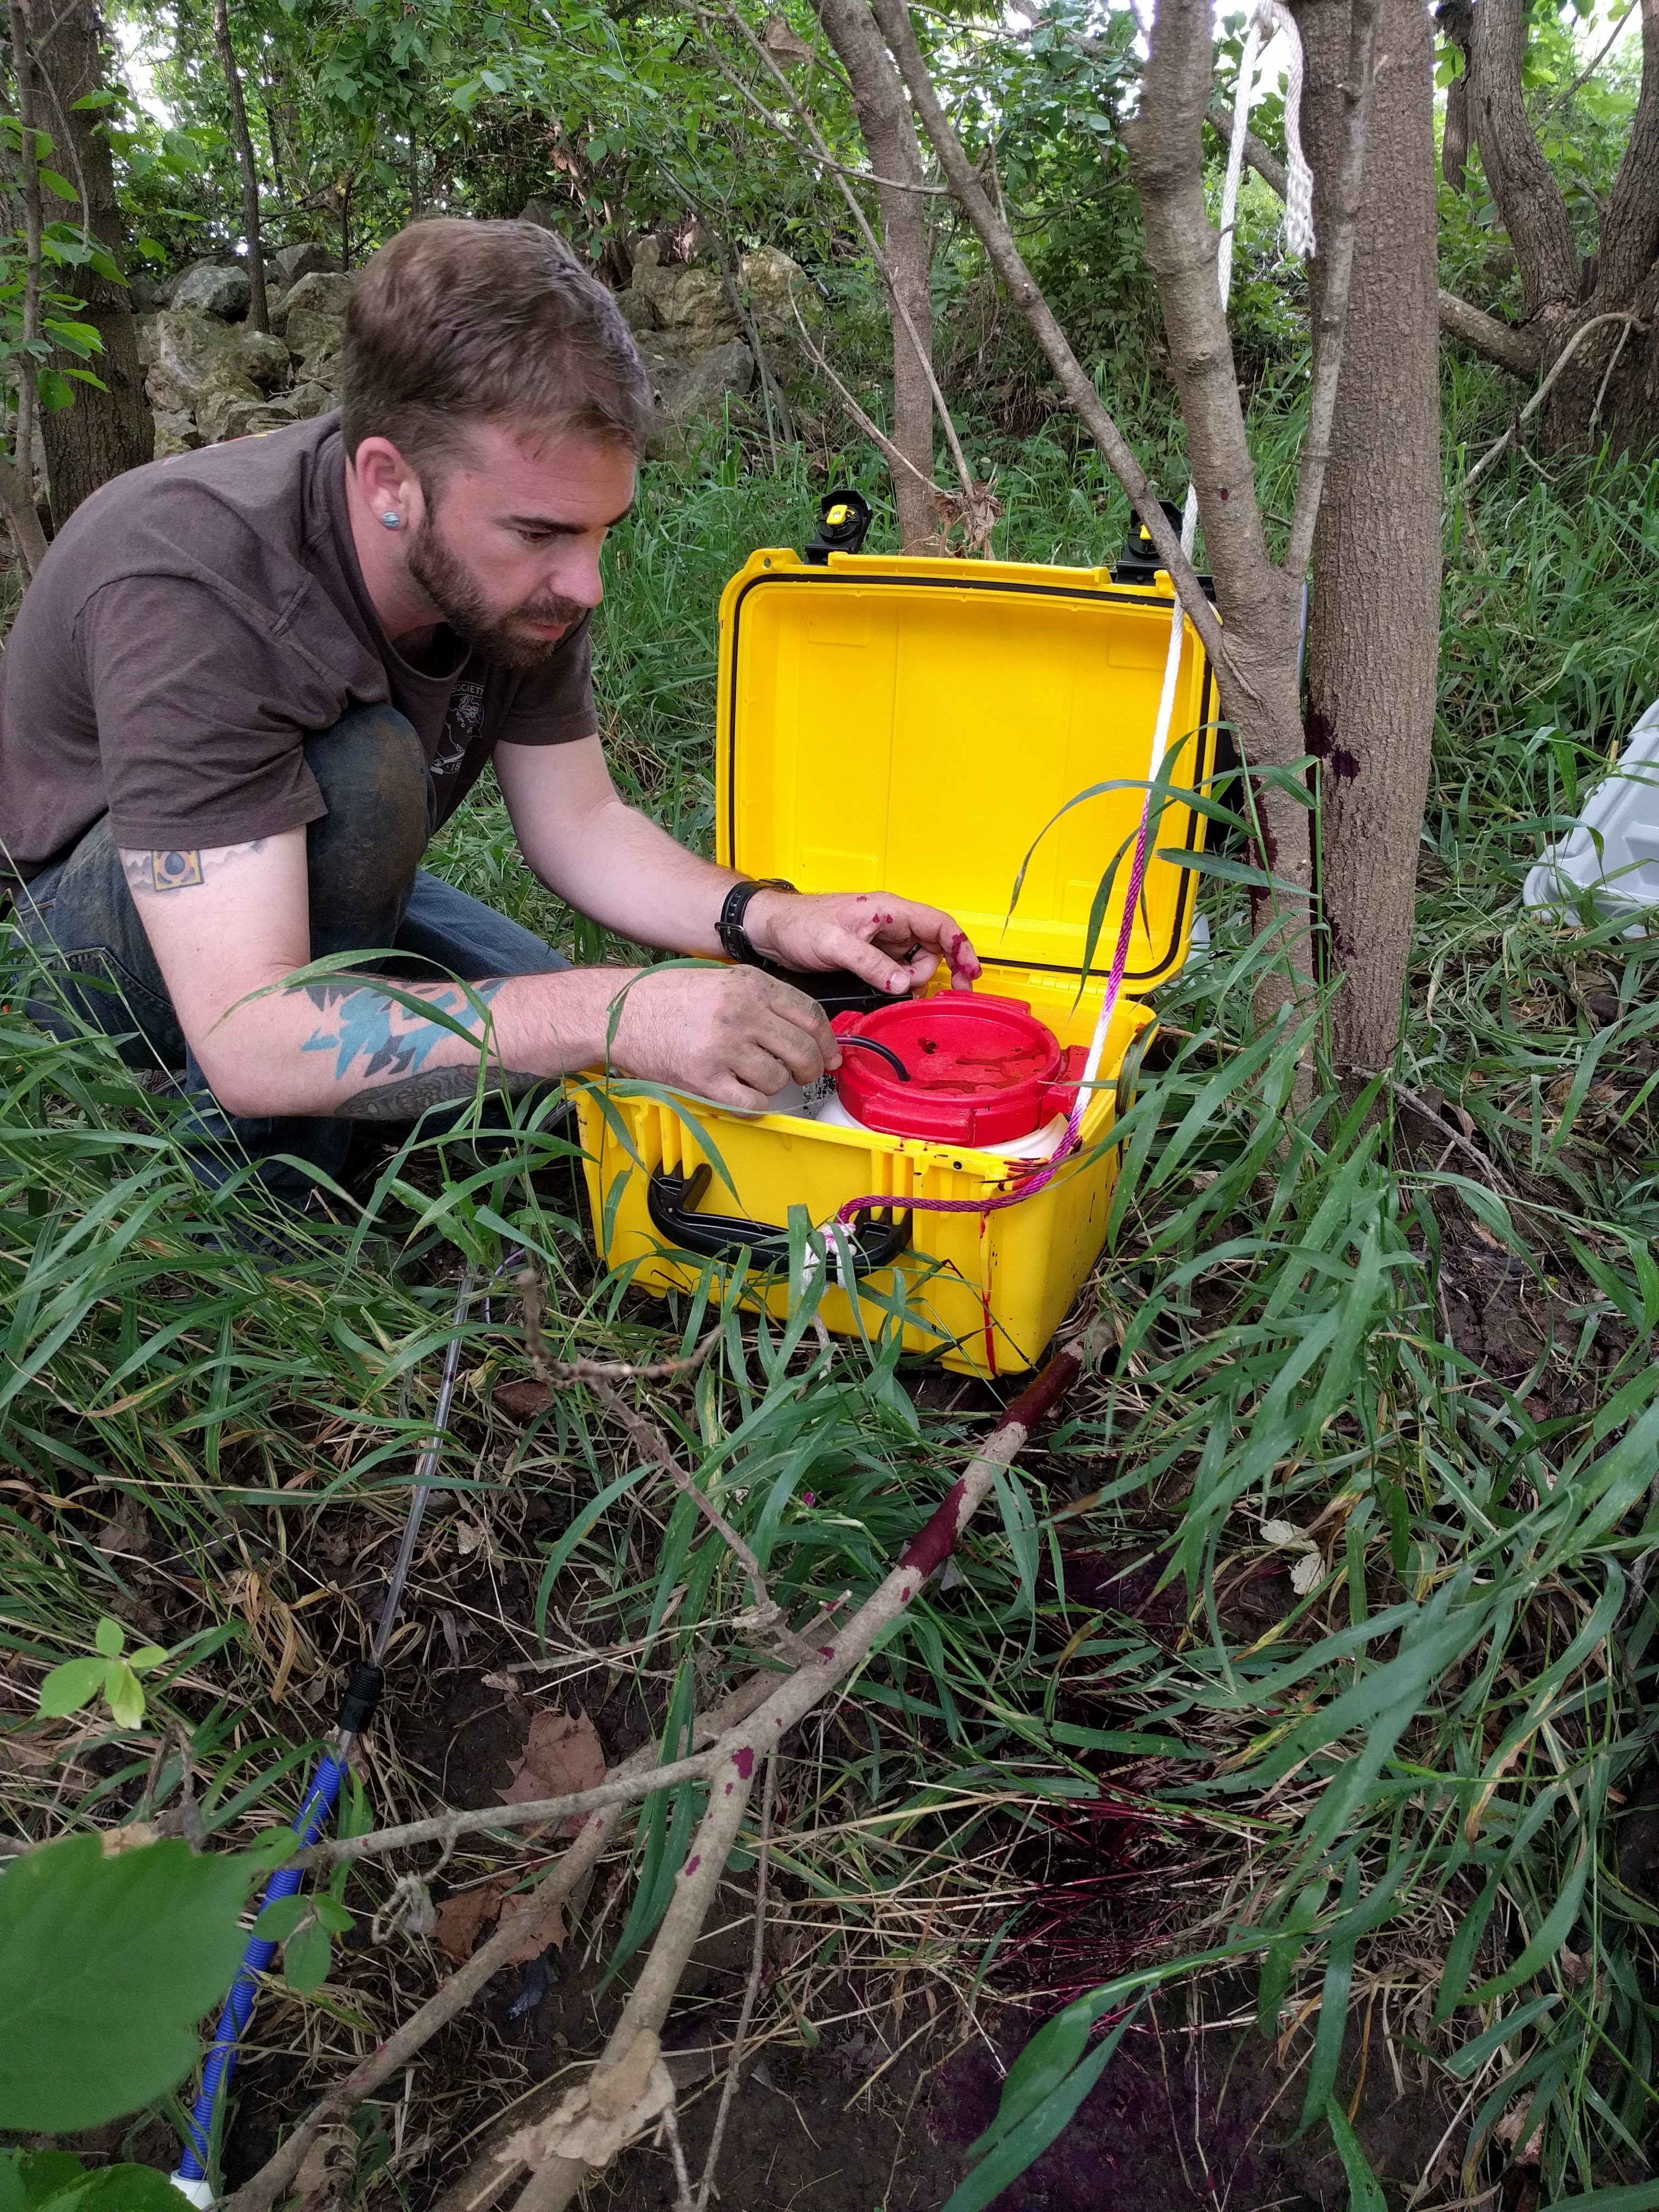
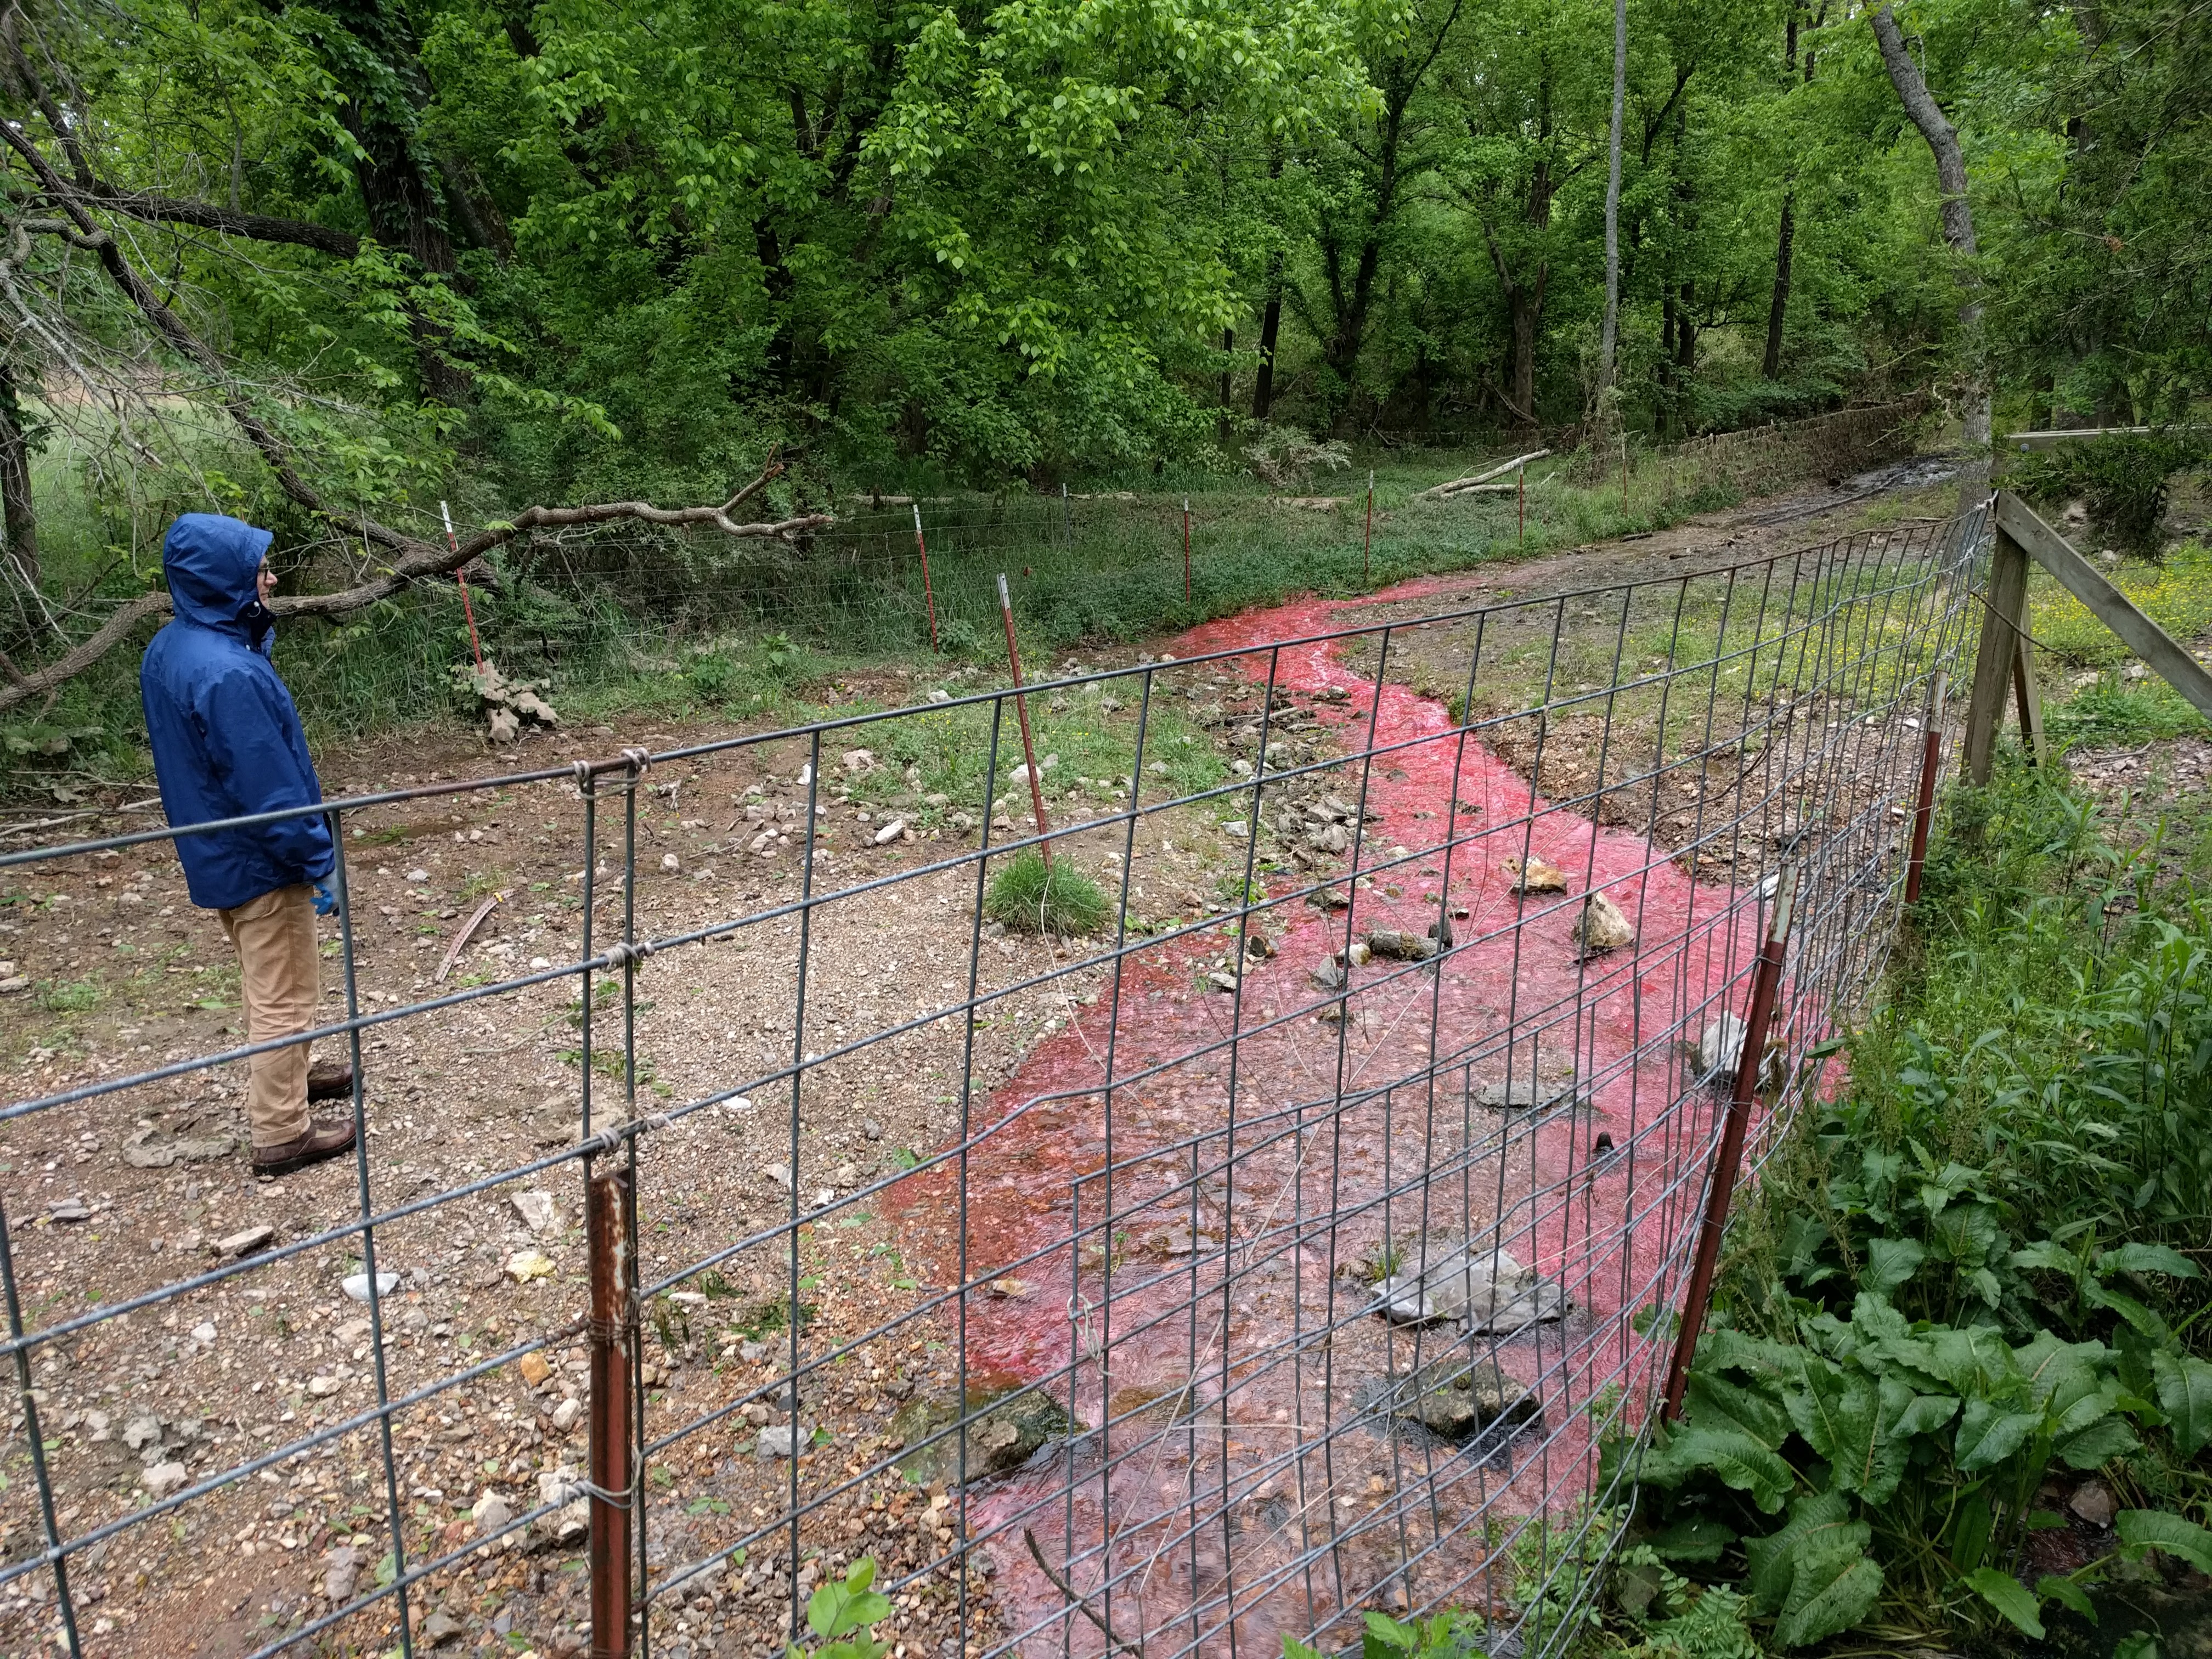
In preparation for work in Greenland this summer, we have been refining our protocols for discharge measurement within the meltwater streams. We will make these measurements by injecting known quantities of a harmless fluorescent dye (Rhodamine) and measuring concentrations of that dye downstream using field fluorometers.
Pumping dye into nalgene bottles for shipment to Greenland.Prototype pump setup for dye injection.Dye in a spring run where we were testing the measurement procedure.Field fluorometers deployed in stream.
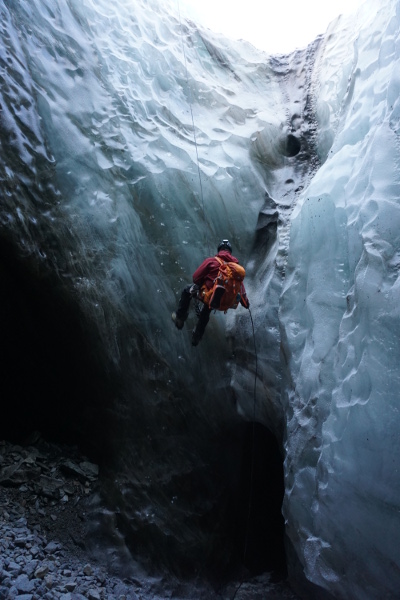
Ken Mankoff rappelling into the moulin entrance of Bird Brain Cave, Hornsund, Svalbard.
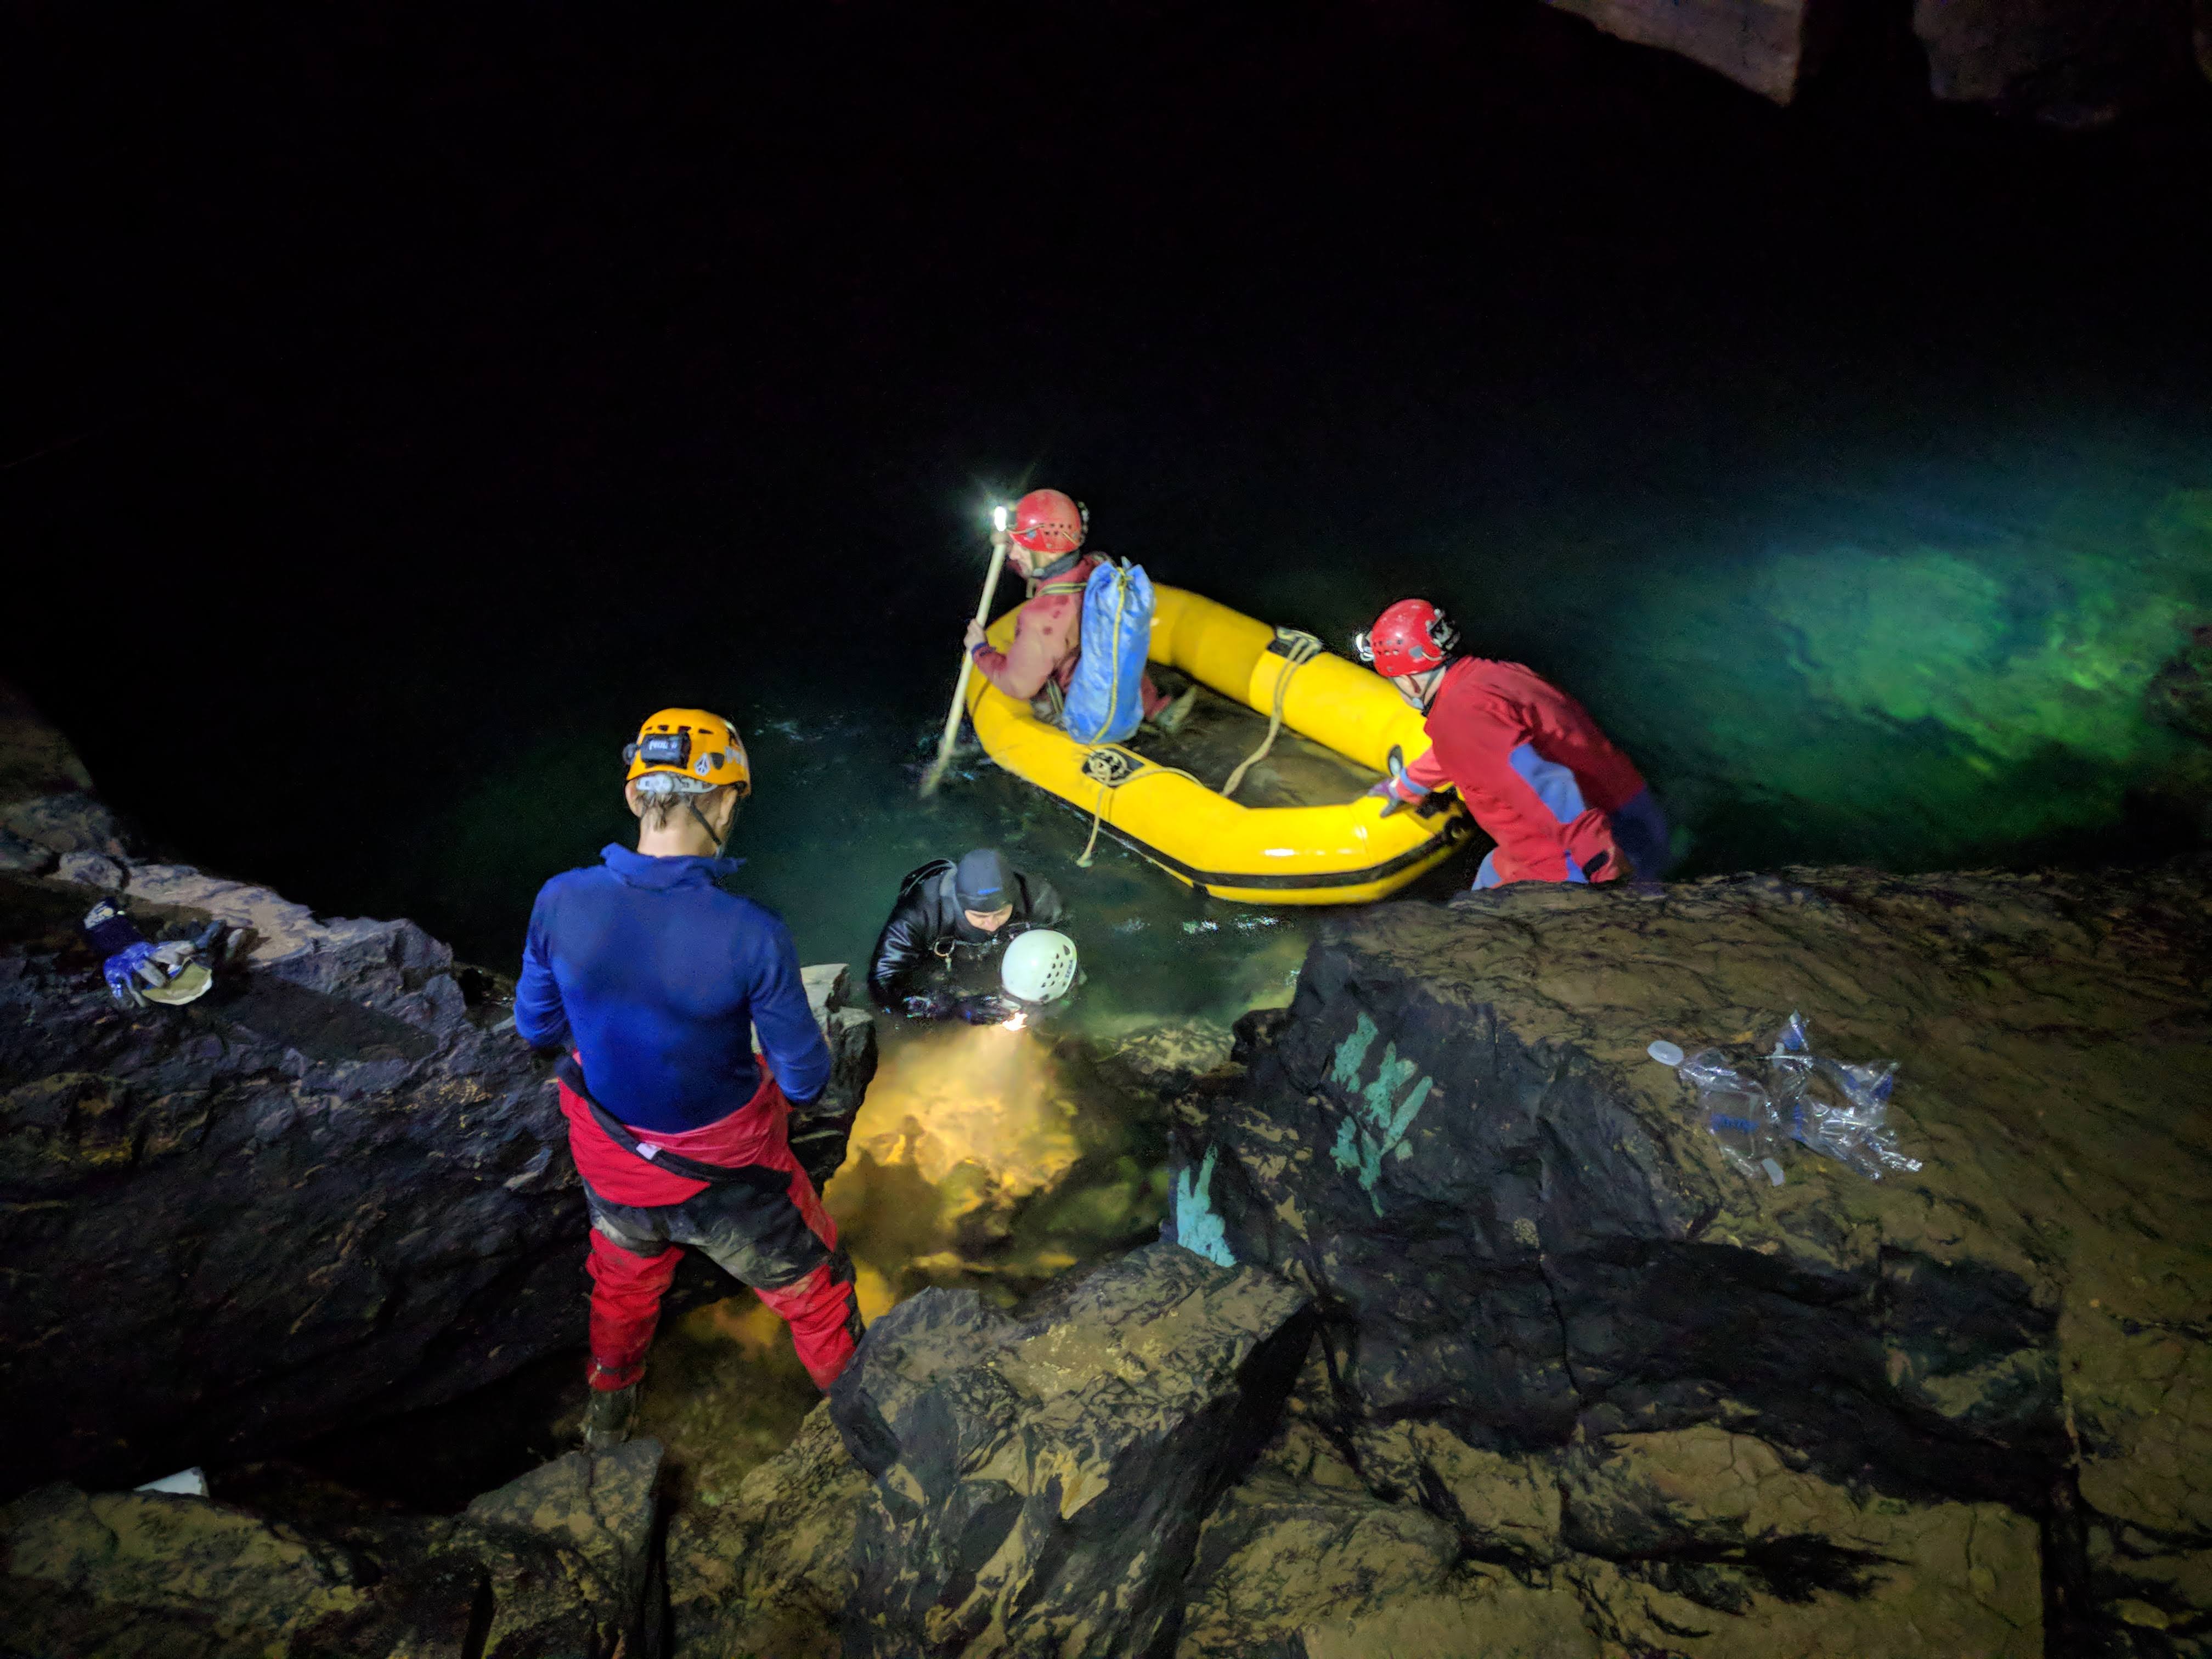
In fall of 2016, I participated in a National Geographic sponsored glacier cave expedition to the Polish Polar Station at Hornsund. The expedition was lead by Ken Mankoff (Penn State). Geomicrobiologist Jenn Macalady (Penn State) and italian geologist/caver/mountaineer Maurizio Mainiero filled out the team. Following up on prior work, the focus of the expedition was 3D scanning within glacier caves. We hoped to better characterize the roughness of subglacial conduits and the impacts that conduit geometry has on subglacial water flow and pressure. In general, glacier caves play an important role in routing meltwater from glacial surfaces to the toe of the glacier. The efficiency of these flow paths can have a strong influence on the speed at which a glacier slides. However, current models of these flow paths are relatively poorly constrained due to a general lack of data. Our trips to the belly of the glacier were aimed at filling this data gap. Our trip was plagued by warm temperatures that made the field work challenging (due to high water in the caves). However, we had just enough days below freezing to collect the critical data we needed.
We acknowledge the valuable support of both the National Geographic Society’s Research and Exploration fund and the Polish Institute of Geophysics, which were our hosts in Hornsund.
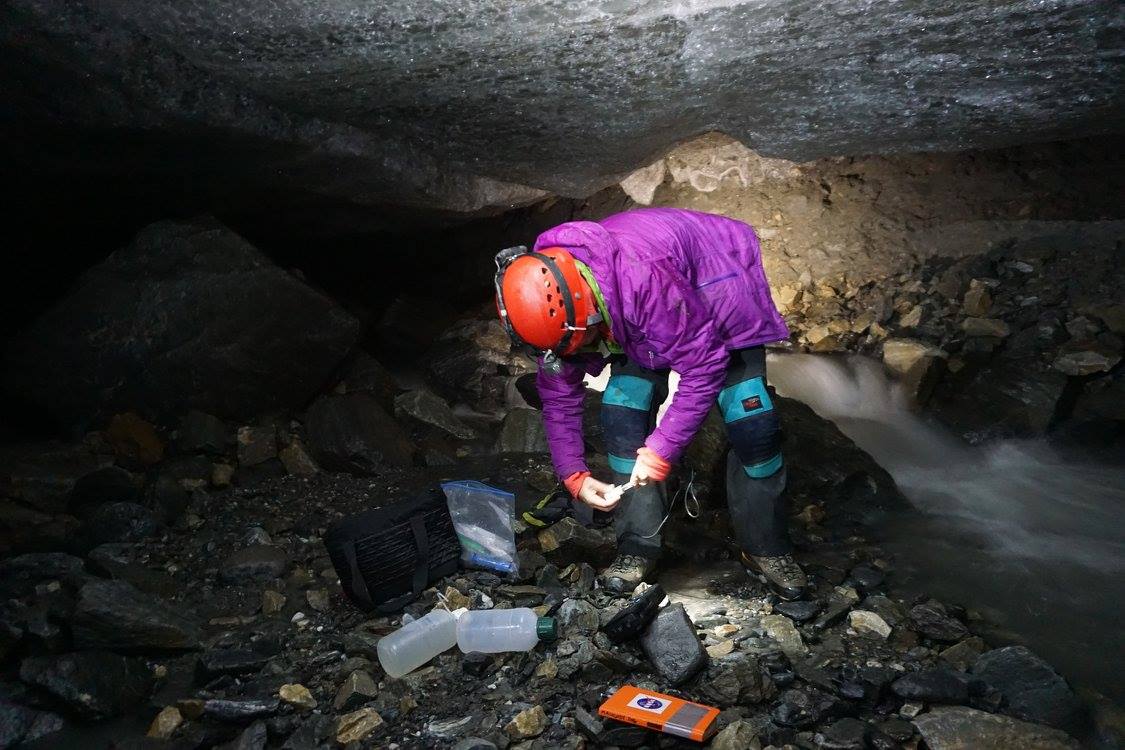
Jenn Macalady taking water samples from the main stream in Bird Brain Cave.
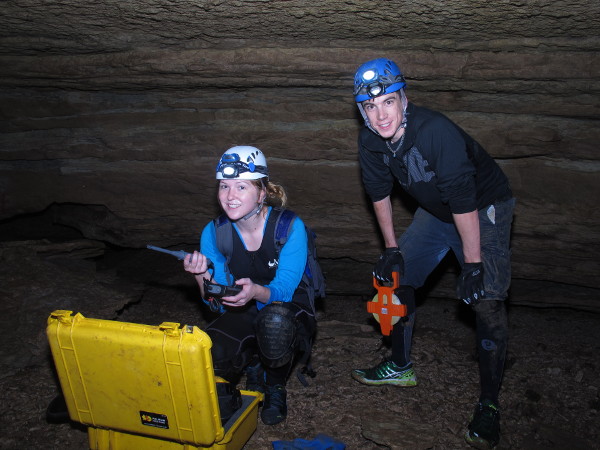
Students in the fall 2014 Karst Hydrogeology course installing equipment and conducting research projects at Blowing Spring Cave.
The Blowing Spring Cave Observatory is a field site that we use for a variety of research and educational purposes. Research at the site started with Kathy Kneirim’s PhD research examining carbon and E. coli dynamics at the site (Kneirim et al. 2013; Kneirim et al. 2015). Equipment to monitor dissolved and gaseous carbon dioxide, as well as air flow velocity and other basic environmental parameters, were installed in spring of 2014. Over 30 additional water quality and air temperature data loggers were installed during Covington’s Karst Hydrogeology course in fall of 2014, resulting in what may be one of the most heavily instrumented caves anywhere. A recent piece on the local NPR showOzarks at Large featured our work at this site.
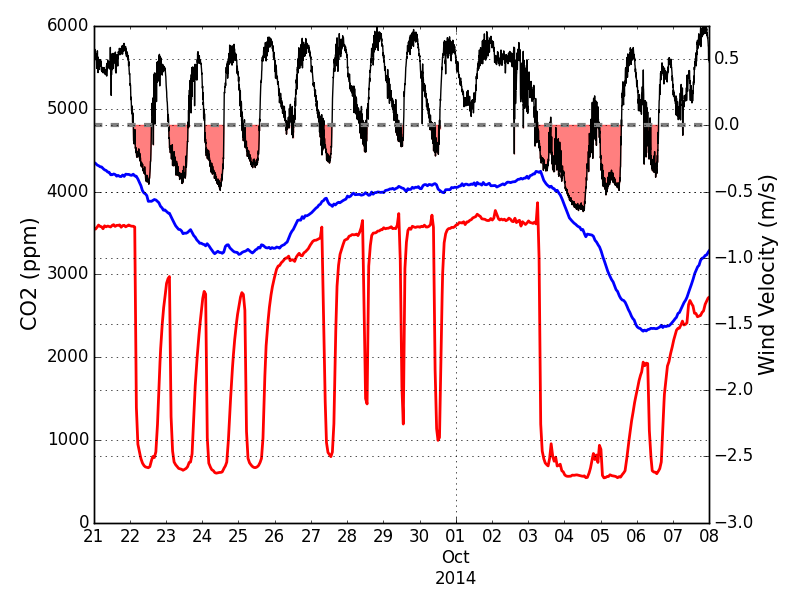
Ongoing work in the cave is focusing on interactions between carbon dioxide concentrations within the cave stream and cave ventilation processes as a part of Holly Young’s masters thesis work. The cave airflow is driven primarily by the chimney effect, where the entrance of the cave acts as a lower entrance. This means that fresh outside air is drawn into the cave during cool periods, whereas air blows out the entrance during warm outside weather. Preliminary data suggest that the periods of time when the cave stream is undersaturated with respect to calcite, and therefore capable of dissolving the limestone rock in which it is formed, are largely controlled by these airflow patterns.
Carbon dioxide concentrations in the air (red line) and water (blue line) of the cave along with cave airflow velocity (black line). Negative velocities (red shading) are periods of time when outside air is drawn into the cave entrance resulting in low concentrations of carbon dioxide in the air. After longer periods of airflow reversal the carbon dioxide concentrations in the cave stream also begin to fall. This tends to result in saturated or supersaturated conditions in the stream.
Undergraduate research, begun in the Karst Hydrogeology course and continued by Alex Breeding, is studying cave air temperature dynamics within entrance zones and trying to quantify distance into the cave that air temperature is influenced by outside temperatures. Contrary to prior theoretical work, our new model and observational data suggest that this zone of external temperature influence expands over the duration of the winter. A few weeks of cave air temperature data are depicted in the animation below. The leftmost data point is outside temperature.
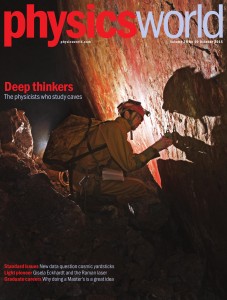
The October cover story of Physics World featured physicist cave scientists, including Covington. This cover photo is in Cueva J2 near a depth of 1000 meters with light reflecting off of a fantastic fault plane.